

Top 6 SaaS Revenue Metrics to Track in 2026
SaaS, also known as on-demand software, is a cloud-based software delivery model wherein remotely-hosted software is distributed to users over the internet on a subscription basis. In return for a monthly or annual fee, the users receive a copy of the software, which they access after a sign-in process via a web browser or an app. Updates and bug fixes to the software are delivered to each user every time they are released.
You may have noticed that software no longer comes in boxes and CDs, and we don’t see software updates being announced with elaborate fanfare anymore. We owe this to the SaaS model. Although its origins can be traced back to the 1960s, it was Marc Benioff of Salesforce who popularized the SaaS concept with his “The End of Software” campaign in 2000. Benioff’s one-man crusade against conventional software received a boost from the rising cloud computing and triggered a chain reaction that eventually gave us Infrastructure-as-a-Service.
Before we take a deep dive into SaaS revenue metrics, check out this video by Dan Martell for a brief introduction into the SaaS concept.
Key takeaways
-
You need to track the right SaaS revenue metrics for your business to make sure you are on the right path.
-
Nuanced metrics like expansion MRR or churned ARR offer actionable insights as opposed to blanket metrics like MRR or ARR.
-
You can use NRR to judge whether you have found traction and metrics like ARPU and CLV to spot high-value customers.
-
SaaS revenue data should be blended with customer data and put into a context for users to be able to make sense of it.
-
A dedicated connector that integrates a CRM like HubSpot and a payment processing platform like Stripe offers users immense value.
SaaS revenue statistics
-
According to Gartner, global end-user spending on SaaS tools grew from $146 billion in 2021 to $167 billion in 2022. The renowned consulting firm forecasts the industry to grow by 16.8 percent in 2023, reaching $195 billion.
-
According to Statista, the average number of SaaS applications used by organizations worldwide rose from 8 in 2015 to 110 in 2021.

Graph showing the increase in the U.S.-based Google searches for the term "saas" from the beginning of the pandemic in March 2021 to May 2023. Image credits: Google Trends. The image was slightly modified for aesthetic purposes.
-
A study conducted by Better Cloud revealed that organizations with more than 1,000 employees use a whopping 177 SaaS tools on average.
-
As of January 2023, there were 337 SaaS unicorns, that is, companies valued at over $1 billion, and 15 decacorns, companies with a valuation of over $10 billion.
What makes the SaaS model so attractive to users?
-
The SaaS model made enterprise-grade software accessible to the masses by spreading the cost of infrastructure over a user base that’s orders of magnitude bigger. This development allowed people to use state-of-the-art software, which they would otherwise not be able to afford.
-
The model popularized usage-based pricing, letting users pick from among the options the best pricing plan for their needs.
-
Firmly based on data about user practices, the SaaS model was able to develop and offer the products customers asked for. Regular feature delivery, security updates, and customization options led to an overall better user experience.
SaaS products, through brands like Salesforce, Netflix, Dropbox, or Google Workspace, have become a significant part of our daily lives. They have boosted online collaboration, helped us achieve major productivity gains, and democratized access to quality software, becoming the dominant form of software distribution today.
What are SaaS metrics?
SaaS metrics are data points that SaaS companies use to gauge their performance and growth. Although growth metrics are the first to come to mind because SaaS businesses are mostly evaluated on how quickly they can grow, there are other kinds of SaaS metrics companies should monitor.
Think of SaaS metrics as the instrument panel a pilot uses to fly a plane. The gauges in the panel provide the pilot with vital information that would otherwise not be available to him through the senses. Much like that, SaaS metrics give decision-makers visibility into the trends and subtle changes in the performance of a SaaS company.
It is thanks to following these SaaS metrics that a company can identify actionable KPIs and make changes to the business plan. Metrics show you the trends you should care about and highlight problem areas.
For example, keeping an eye on the usage rates of individual users may let you notice in advance the users that are about to churn. The conversion rate gives you insight into how well your marketing efforts resonate with potential customers. Some metrics allow you to discover your most valuable users so that you can devise customer loyalty plans to keep them happy. Others, like the customer engagement score or the net promoter score, can tell you a lot about how satisfied customers are with your product.
See this video by David Skok, investor and renowned SaaS guru, for a discussion of SaaS metrics and why they matter for a SaaS business:
6 key SaaS revenue metrics to track
1 - Monthly Recurring Revenue (MRR)
MRR is defined as a normalized metric indicating how much a business can expect to earn in a month on a regular basis. It is an indispensable metric for companies employing a subscription-based business model.
How is MRR calculated?
MRR is the product of the Average Revenue Per User (ARPU) figure multiplied by the total number of subscribers.
MRR = Average Revenue Per User (ARPU) X Total Number of Subscribers
If your customer base consists of subscribers on annual contracts in addition to customers on a monthly plan, make sure that you calculate the average monthly revenue you earn from annual subscriptions.
Let’s say you have 20 monthly subscribers on a monthly fee of $40 and 5 customers paying you an annual fee of $360 per year. Your MRR is $950.
MRR = (20 X 40) + (5 X 360/12) = 800 + 150 = $950
Types of MRR
MRR is a blanket metric that needs to be broken down into lower—level metrics used for more precise analysis.
New MRR: The monthly revenue you can expect to collect from new customers who subscribed to your product or service.
Expansion MRR: The additional monthly recurring income generated by upselling or cross-selling to existing customers.
Churned MRR: The fall in the monthly recurring revenue resulting from customers who canceled their subscriptions.
Contraction MRR: The loss of monthly recurring revenue due to customers switching to a pricing plan that is priced lower than the existing one.
Net New MRR: The change in your monthly revenue compared to the previous month.
Net New MRR = New MRR + Expansion MRR - Churned MRR
Why does MRR matter?
MRR allows you to identify trends in your subscription revenue and churn. The monthly revenue that you can realistically expect to earn in the future has a profound impact on your growth predictions, hiring decisions, and the funding you will need to support your operations. Investors, too, rely on MRR to assess how fast a business is growing and its future potential.
2 - Annual Recurring Revenue (ARR)
ARR is the total amount of recurring revenue a business earns from its subscribers normalized for a year. As opposed to MRR, which brings to light the operational efficiency of a business, ARR highlights its long-term viability.
How is ARR calculated?
In general terms, ARR is equal to MRR multiplied by 12.
ARR = MRR X 12
There is a caveat, though. When you have customers on multi-year contracts, you have to normalize the value of those contracts by dividing them by the number of years.
Suppose you have 12 subscribers on one-year contracts worth $1,000, 10 subscribers on 2-year contracts worth $1,800, and 5 subscribers on 3-year contracts worth $2,400, which means you have an ARR of $25,000.
ARR = (12 X 1,000) + (10 X 1,800/2) + (5 X 2,400/3) = $25,000
Types of ARR
Just like MRR, ARR, too, is a blanket metric that needs to be broken down into lower—level metrics used for more precise analysis.
New ARR: The annual revenue a business can expect to collect from brand-new customers.
Expansion ARR: The increase in the annual recurring income generated by upselling or cross-selling to existing customers.
Churned ARR: The reduction in the annual recurring revenue caused by cancellations.
Contraction ARR: The loss of annual recurring revenue due to customers switching to a pricing plan priced lower than the existing one.
Net New ARR: The change in the annual revenue compared to the previous year.
Net New ARR = New ARR + Expansion ARR - Churned ARR
Why does the ARR matter?
ARR is a reliable indicator of a SaaS business’ health. It’s the main metric investors take into account while gauging the potential of a startup. A consistently growing ARR in the typical “hockey stick curve” fashion tells investors that the business in question has validated its business model and found the product-market fit.
Some investors would like to see startups hit certain growth targets to justify an investment, like Neeraj Agrawal of Battery Ventures, who thinks successful SaaS startups should grow 72X growth in ARR in 5 years (3X-3X-2X-2X-2X).
3 - Average Revenue Per User (ARPU)
ARPU refers to the earnings a business generates per user. It is a key metric used to gauge the profitability of SaaS companies.
How is ARPU calculated?
To calculate the ARPU, you should first determine the timeframe of analysis. This could be monthly, quarterly, or yearly, depending on the business model. Having calculated your total revenue in that period, you should then divide it by the total number of users to find your ARPU.
ARPU = (Total revenue over a specific period) / (Total number of users in that period)
Why does ARPU matter?
ARPU is a function of the industry you are operating in and, in turn, determines how you acquire customers and sell products. ARPU also speaks volumes about the spending habits of your customers.
Recent studies reveal that ARPU growth accelerates as ARPU per month increases. Customers with higher ARPUs tend to be more loyal and less likely to churn. They are power users that make products a bigger part of their lives. Companies enjoying higher ARPUs can expect to have higher expansion revenue as they can talk their customers into spending more for the product through upselling and cross-selling.
4 - Net Revenue Retention (NRR)
Net Revenue (Dollar) Retention refers to the percentage of the recurring revenue a business can retain over a period. It is the sign of a company’s capability to keep its customer base and build upon it through expansion. The term successfully captures the compounding effect that successful SaaS companies are known for.
How is NRR calculated?
To calculate NRR, you take your starting MRR and add to it the recurring revenue you generated by upselling and cross-selling to the same customer base (expansion MRR). You then subtract from that figure the lost revenue caused by customers switching to lower-level plans and the churned MRR from the cancellations. You then divide this figure by the starting MRR number and multiply it by 100.
NRR = [(Starting MRR + Expansion MRR — Contraction MRR — Churned MRR) / Starting MRR] X 100
Why does NRR matter?
Positive NRR proves that you do not have a leaky bucket and that you add to your revenue faster than your customers cancel or downgrade their subscriptions. That’s why SaaS companies with high NRRs tend to receive much higher valuations than the ones with low NRRs.
NRR can be seen as the 'north star metric' for SaaS businesses because it gives you the bottom line of all your activities. Rather than maniacally marketing your product to potential customers, this metric emphasizes the need to keep existing customers happy. NRR is probably the metric that Airbnb CEO Brian Chesky had in mind when he said, “Build something 100 people love, not something 1 million people kind of like.” NRR highlights the fact that SaaS startups should take customer success seriously.
5 - Customer Lifetime Value (CLV or CLTV)
CLV refers to the total revenue a business can accrue from a customer over the course of the business relationship. CLV sheds light on the customer profile that can be expected to generate the most revenue for a company.
How is CLV calculated?
Calculating CLV can be tricky as it requires forecasting future earnings from a customer, which is impossible to know for sure. However, modeling CLV as the product of the customer value multiplied by the average customer lifespan would be a good estimate. ARPU gives us the customer value we need for this formula. Dividing 1 by the customer churn rate, we can approximate the number of transactions a customer will complete before churning. So the CLV formula is:
CLV = (Average Revenue Per User) / (Customer Churn Rate)
Why does CLV matter?
Calculating the CLV allows a company to identify its most valuable customers. It can guide the efforts to create more effective marketing and sales campaigns and leverage less expensive channels to reach out to customers with a higher acquisition cost than lifetime value.
One of the more sensible ways decision-makers willing to cut costs can take is to invest in the relationship with existing high-value customers. Nurturing this relationship through customer success and loyalty programs helps boost expansion revenue. Looking at the product range through a CLV perspective can result in products or services that don’t generate enough value getting phased out. Low CLV can indicate problems with certain business operations, and remedying these can generate more revenue for a company.
6- Monthly Churn Rate
The monthly churn rate is the percentage of customers a business loses in a given month. It is a metric that’s indicative of how well a product resonates with customers. A high monthly churn rate implies that the business is a long way from the product-market fit and has urgent problems it has to deal with.
How is monthly churn rate calculated?
To calculate the monthly churn rate, you should first calculate the difference between the number of customers at the beginning and end of the month. Dividing this number by the number of customers at the beginning of the month and then multiplying the quotient by 100 gives you the percentage of customers you lost in a given month.
Monthly Churn Rate = [(Number of customers at the beginning of the month) - (Number of customers at the beginning of the month)] X 100 / (Number of customers at the beginning of the month)
Why does monthly churn rate matter?
A high monthly churn rate undermines your growth and signals that something is seriously wrong with your product, onboarding process, or customer support. Left unattended, the compounding effects kick in and can have a devastating impact on the business over the long haul.
However, focusing solely on customer churn in a month can be misleading as a small number of high-value accounts churning may be more destructive for your business than a large number of low-value customers canceling their plans. Therefore, monthly revenue churn might be a better indicator of performance compared to the plain monthly customer churn.
Why should you measure SaaS revenue metrics?
- To get a sense of the health of your business (MRR, ARR, NRR)
- To be able to forecast your future income and plan ahead (CLV)
- To make realistic projections about the length of your runway (MRR, ARR, NRR)
- To document the growth of your business when pitching investors (NRR, ARR, ARPU)
- To plan your future strategies to engage which customers and how (LTV)
- To understand how your funnel performs and which stage needs improvement (ARPU, CLV)
- To identify and keep an eye on your high-value customers and their spending (ARPU, CLV)
- To discover the people among your customers who can become evangelists for your product (ARPU, CLV)
Challenges associated with SaaS revenue metrics
-
The first challenge is a technical one. It involves pulling in data from a payment processing platform and blending it with the customer data stored in a CRM platform. Without proper connectors in place, this is a job that needs to be done manually, most of the time using spreadsheets. Seamless and real-time integration between two platforms can save frontline workers a lot of time and effort while unlocking insights for decision-makers.
-
Once the technical challenge is overcome through a data integration tool, then the consolidated data needs to be presented in a way that makes it easy to understand for marketing and sales teams and decision-makers. Trends might be difficult to discover when data is presented in tabular form, but seeing your monthly churn rate shooting through the roof in a graph can serve as a wake-up call for you and your team. That’s why dashboards are necessary for people dealing with B2B SaaS analytics.
-
The last challenge involves what to make of metrics. A metric like MRR is just a number. It needs to be considered in relation to other data to inform decisions. This requires making the data from one source talk with data from other sources. MRR on its own may tell you whether your business is doing well or not, but it does not reveal much about the underlying reasons.
Filtering the MRR by pricing-plan changes your perspective a little, offering you a glimpse into your ideal customer profile. But to gain insights that you can act upon, you need to break down the MRR (or LTV, churn, or any other metric) into country- and company-based segments. It is only at this level that numbers can help you form hypotheses that you can test with your actions.
Benefits of integrating key SaaS revenue metrics with your CRM data
Blending SaaS revenue and CRM data maximizes the potential of SaaS data, providing valuable insights for businesses to make informed decisions. Here's what you may expect to gain from this integration:
A chance to contextualize bare revenue metrics for better understanding
-
Raw SaaS revenue data only provides information on revenue trends without any actionable insights. MRR, ARPU, and monthly churn charts reveal trends, but they do not tell you what you should do to maintain or reverse them.
-
Combining SaaS revenue and CRM data provides users with context, allowing for a breakdown of revenue metrics such as MRR, ARPU, and monthly churn into country- and company-based components.
Actionable insights to inform future decisions
-
Importing customer data from CRM platforms adds depth to raw SaaS revenue data, which enables users to see the impact specific customer attributes like country, industry, and company size have on revenue data.
-
Armed with new insights, marketing and sales teams can form ideal customer profiles, target high-value accounts, and explore cross-selling and upselling opportunities.
4 tools for tracking key SaaS revenue metrics
The rise of the SaaS business brought about an increase in the number of tools that bring together SaaS data and help users visualize that data in a dashboard. Here are four popular tools that are worth a look:
Peaka
Developed with a vision to help startups and SMBs eliminate data silos, Peaka has an easy-to-use offering for people looking to bring revenue and customer data together. Of the plethora of integrations Peaka comes with, the dedicated HubSpot-Stripe connector holds great promise for startups and SMBs. Thanks to this connector, users can pull in payment data from Stripe and join it with the customer data they keep in HubSpot.
Most data integration tools can provide users with an MRR, ARPU, or LTV figure based on the pricing plan chosen-that's nothing new. Peaka goes one step further, though, and allows for further segmentation of this data according to country, company size, industry, or funding information, giving users a more granular view of their data. As a result, a Peaka user can, for example, generate reports showing the MRR from her customers based in Germany with a staff size between 10 and 100.
Our HubSpot-Stripe integration unlocks invaluable insights for both frontline workers and decision-makers. Marketing and sales professionals can use these insights to form ideal customer profiles. They can target high-value accounts and develop personalized messaging for accounts that drive most of the revenue for the company. The insights gained from HubSpot-Stripe integration enable high-level decision-makers to adjust resource allocation and achieve better ROI from marketing dollars.
ChartMogul
ChartMogul offers integrations with platforms like Stripe, Securely, Chargeable, and PayPal. It allows users to consolidate their revenue data and apply filters like churn or MRR by currency, region, plan, or cohort. However, when it comes to achieving a more granular segmentation like MRR-by-region-by-pricing plan, ChartMogul comes up short. ChartMogul offers a Pipedrive integration via Zapier, which lets users pull in customer data. But the lack of a HubSpot integration seems like a glaring problem for many users. Instead of focusing on integrations with major CRM platforms, ChartMogul seems to be charting a new course nowadays.
{{ resize_image(path="../static/assets/images/blog-images/saas-revenue-metrics-chartmogul.png", width=759, height=400, op='fit_width, alt="ChartMogul screenshot") }}
A ChartMogul screen showing the breakdown of customer lifetime value data by pricing plan. Image credits: Youtube Video.
The company recently launched the ChartMogul CRM. Instead of enabling users to pull in data from their existing CRM platforms, ChartMogul wants to become the CRM platform customers store that kind of data in. Users will keep their customer data on ChartMogul CRM and merge it with revenue data from Stripe to form detailed reports. Whether this bold move will be enough to sway people away from established CRMs like HubSpot or Salesforce remains to be seen.
ProfitWell
Another popular analytics software for B2B SaaS data is ProfitWell. ProfitWell provides its users with integrations with payment processing platforms like Stripe, Chargeable, and Zuora. Users can pull in the revenue data from one of these platforms and break down the data into components like MRR, growth rate, churn rate, LTV, and ARPU and filter them by pricing plan, industry, or region. The tool also comes with one of the more capable dashboards in the market and lets users turn data into slick charts and graphs.
{{ resize_image(path="../static/assets/images/blog-images/saas-revenue-metrics-profitwell.png", width=759, height=400, op='fit_width, alt="ProfitWell screenshot") }}
| A screenshot from the ProfitWell demo dashboard showing the breakdown of customer lifetime value data by pricing plan. Image credits: ProfitWell.|
On the customer data front, ProfitWell works with Clearbit and Fullcontact to enrich the existing data with contact information and form ideal customer profiles. It also has a dedicated HubSpot connector that combines revenue and CRM data. This connector offers automated workflows that are triggered depending on parameters such as customer engagement or plan status and seems to have received mostly positive reviews from users.
Baremetrics
Baremetrics is another viable option for people looking for a B2B SaaS analytics tool. It allows users to track usual metrics like MRR, LTV, churn, or reactivations and see how these metrics change according to the pricing plan selected by customers. Similar to ProfitWell, Baremetrics offers a colorful dashboard that turns metrics into beautiful visualizations.
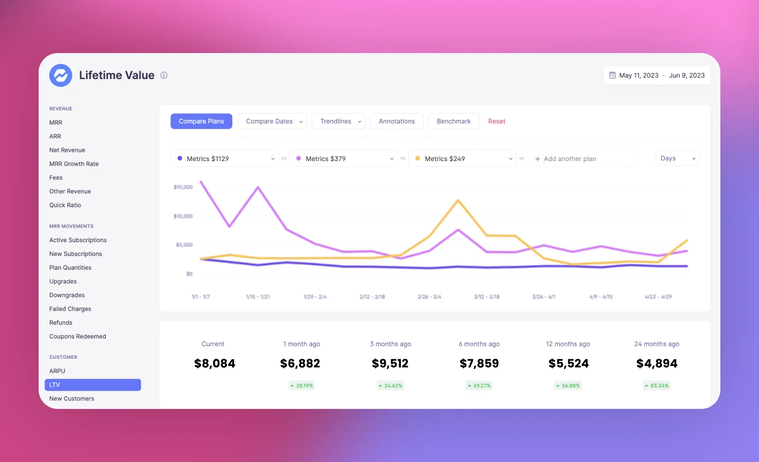
A screenshot from the Baremetrics demo dashboard showing the breakdown of customer lifetime value data by pricing plan. Image credits: Baremetrics.
With Baremetrics, users willing to take a more detailed look at their revenue metrics and merge them with customer data can import data from certain CRM platforms like Pipedrive. After pulling in the CRM data as attributes, they can blend it with the existing revenue information to view how revenue MRR, LTV, or churn changes in relation to region or industry. This capability helps decision-makers put things into context while evaluating the performance of sales teams or the effectiveness of marketing campaigns. However, the platform currently lacks a HubSpot connector, which undermines its appeal to a large user base used to working with it.
SaaS revenue metrics content to consume
- Video – SaaS Metrics and Benchmarks — Based on Thousands of SaaS Businesses
- Article – What is SaaS?
- Article – What are SaaS Metrics?
- Report – ChartMogul 2023 SaaS Benchmarks
Conclusion
SaaS is a game of compounding— compounding your customer base and your revenue. To win in this game, it's essential to maintain a comprehensive understanding of your business, and that means closely monitoring your revenue metrics.
But first things first, you need to start with gathering all your data in one place. Being data-driven won't work if you have scattered information. Real-time data integration that consolidates customer and revenue data, while also allowing for country- and company-based customer segmentation, can provide a fantastic competitive edge for SaaS companies. In that regard, data integration and business analytics tools hold the key to the future for SaaS businesses.
 Please
fill out this field
Please
fill out this field