
The Ultimate Guide to Key SaaS Metrics that Move the Needle
Introduction
The SaaS industry has a strong focus on growth, which can be attributed to the significant influence of venture capitalists (VCs). For a long time, VCs have prioritized high-growth projects, even if they were not generating profits and had high cash burn rates. This preference for growth has set the standard for the industry as a whole, making growth metrics essential for SaaS companies.
The emphasis on growth in Silicon Valley culture is not surprising. After all, it is what separates startups from SMBs. Startups that fail to grow fast will either go out of business or become SMBs in the best-case scenario. This cultural fixation with growth has helped produce analogies like the “hockey stick curve,” which refers to the exponential growth investors want to see from SaaS startups.
Despite the calls for prioritizing profitability over growth over the last twelve months, growth metrics are still critical for SaaS companies. We will take a long, hard look at five of them in this blog post.
What are SaaS growth metrics?
SaaS growth metrics refer to the benchmarks SaaS companies can use to assess the quality of the growth they achieve. Growth metrics can be grouped into four categories:
- Acquisition-related (CAC, conversion rate),
- Activation-related (signups, number of apps created, number of contacts added),
- Revenue-related (MRR, ARR, average contract value),
- Retention-related (number of customers churned, amount of revenue churned, net revenue retention, Net Promoter Score, customer lifetime value) metrics.
Key takeaways
-
Growth metrics are essential to gauge the performance of a SaaS startup and decide whether it is worth an investment.
-
While the SaaS industry was characterized by a “growth at all costs” mentality in the past, balancing growth and profitability has become a priority recently. As a result, the rule of 40 has become a popular metric in SaaS circles.
-
A company with a high gross margin may be more highly valued than another with twice as much revenue but a much lower gross margin.
-
Burn rate is a good indicator of how efficient your revenue generation activities are.
SaaS growth metrics in numbers
-
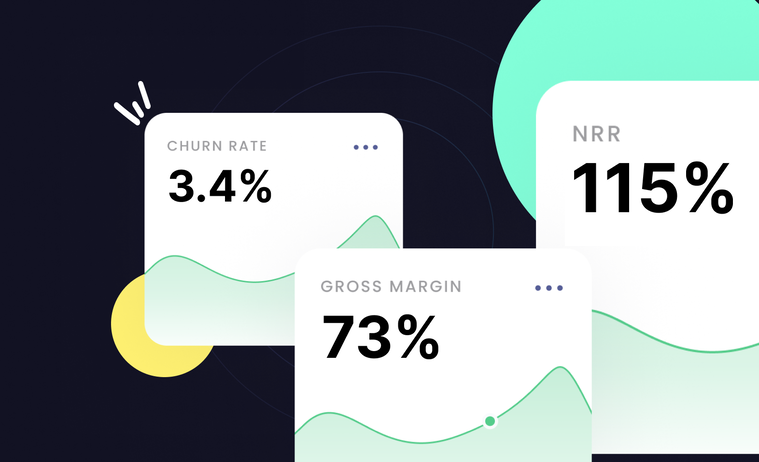
The average customer churn rate for a SaaS company is between 5-7 percent, and a monthly churn rate of 3 percent is considered good.
-
A good NRR rate for SaaS businesses is around 115 percent, according to Dave Kellogg.
-
The gross profit margin for a successful SaaS company should be above 70 percent.
Why should you track SaaS growth metrics?
SaaS growth metrics serve two fundamental purposes related to your operations and how your company will be seen by investors.
To monitor how the company is performing
“You can’t manage what you can’t measure.” Attributed to Peter Drucker, this quote sums up why you need to track your growth metrics. Quantifying your company’s performance enables you to see the things you are doing well and not so well and identify relations between different functions like customer acquisition, onboarding, sales, and marketing.
Growth indicates to outsiders a lot of information about your business. Strong growth validates the initial hypotheses you made about the market, the problem, and your solution. It also pulls a startup out of “the chasm,” the state of affairs where you don’t know whether what you are doing is right or wrong because there is no traction. Sustained growth starts the feedback loop and shows you what actions you should scale.
To attract investors
Venture capital firms and angel investors believe in Power Law. In search of the next Airbnb or Facebook, they spread their funds over a wide range of investments, knowing beforehand that most of their investments will fail: Renowned angel investor Ron Conway puts the number for the failure rate at 40 to 60 percent. The handful of investments that pan out have to be so successful that the ROI of the whole portfolio will be positive.
That’s why investors hope to discover that generational technology or the next big thing and score a few home runs that will make up for these losses and produce a healthy return on all the money invested. When you are like Peter Thiel, who invested half a million dollars in Facebook and made around $1.1 billion from this investment for an ROI of 2,220X, you can easily forget about your investments that fizzled out. That’s why investors value growth over everything else.
You need to document your growth to win the hearts of people like Conway and Thiel. But how much growth does your SaaS company need? Neeraj Agrawal of Battery Ventures puts a number on it: He’d like to see his portfolio companies achieve 3X-3X-2X-2X-2X growth in ARR over five years. So, a startup that has achieved $2 million in ARR will have to hit $6 million, $18 million, $36 million, $72 million, and $144 million to earn Agrawal’s backing.
Jess Bartos of Salesforce Ventures agrees with Agrawal:
"[As investors,] we usually like to see getting from zero to one. From the time you launch your product to reaching a million of ARR in around 12 months or less. And then triple, triple, double, double, double —where you triple for two more years and then double every year from that."
Tracking your growth metrics should be the first step on your checklist if you are planning to meet investors for fundraising purposes.
5 key SaaS growth metrics to monitor
There are tens of SaaS growth metrics you may track, but very few can provide you with the kind of powerful insights the five metrics below offer:
Churn rate
In the SaaS world, churn refers to the number of subscribers who cancel their subscriptions in a month, quarter, or year, expressed as a percentage of subscribers at the beginning of the period.
To calculate the churn, you divide the number of customers lost in a time period by the total number of customers at the beginning of the period and multiply the result by 100.
Monthly Churn Rate = [(Number of customers at the end of the month) - (Number of customers at the beginning of the month)] X 100 / (Number of customers at the beginning of the month)
One should keep in mind that the churn rate calculated will probably understate the real churn rate, as there will be people who would like to churn but can’t because they are bound by a contract. Therefore, excluding these people from the initial number of customers might be a good idea.
Why does churn matter?
Churn is the opposite of growth and works in a way that offsets it. A high churn rate is a symptom of the lack of product-market fit and can signal problems with your product, onboarding, customer support, and customer success functions.
Dan Martell taps into his experience as an entrepreneur and gives some practical advice on how to reduce churn in this video:
The real issue with churn is how monthly compounding can turn it into a menace to be reckoned with.
Annual Customer Churn Rate = (1 — (1 — Monthly Churn Rate)^12)
Thus, a seemingly innocent-looking monthly churn rate of 6 percent will amount to an annual churn rate of 52.4 percent. That’s more than half of your customers gone within a year. Think for a moment that you had 1,000,000 subscribers at the beginning of the period and lost 524,000 of them throughout the year. Ouch!
For a more nuanced look at the churn rate, it would be wise to keep an eye on the revenue churn, as well. Losing a small number of customers can still cripple your business if those accounts turn out to be high-value accounts. Eliminating churn altogether is impossible because people die, they forget to renew their subscriptions, or their credit cards expire. But you can always focus on your Tier 1 accounts instead of the smaller deals if deal sizes vary across your customer base.
Net Revenue Retention
Net revenue retention (NRR) is the cumulative total of your retained, contracted, and expanded revenue over a period (a month, quarter, or a year), expressed as a percentage of revenue in that period.
For monthly NRR, you add the revenue you earned from upselling and cross-selling (expansion MRR) to the base MRR figure at the beginning of the period. You then subtract the revenue you lost due to downgrades to a lower pricing tier (contraction MRR) and churned customers (churned MRR). Dividing the result by the MRR figure at the beginning of the period and multiplying it by 100 gives you the NRR figure you are looking for.
NRR = [(Starting MRR + Expansion MRR — Contraction MRR — Churned MRR) / Starting MRR] X 100
Why does NRR matter?
NRR is a measure of your customer success function and speaks volumes about how well your customers were able to extract value from your product. It doesn’t let revenue from new contracts cloud your judgment, as it excludes the revenue growth provided by the newly acquired customers, which could change the picture by making up for the revenue lost from churning or downgrading customers.
The NRR gives you two important insights:
- How much growth your existing customers can generate for your SaaS business,
- How happy your existing customers, the contracts you already won, are with your product.
NRR is a critical metric for SaaS companies because it shows the way to cost-effective growth: Reduce churn and increase customer lifetime value through upselling and cross-selling. Rather than pouring money into customer acquisition to sustain a leaky bucket model, NRR encourages you to fix your onboarding issues, give your customers a better product experience, and invest in your customer success team to increase revenue.
An NRR rate of 100 percent implies that you have a stable ARR base that is neither growing nor shrinking, without taking newly acquired customers into account. An NRR rate of greater than 100 percent tells you that your company is able to grow by leaning on its existing customer base alone.
A study of 98 SaaS companies that disclosed their net revenue retention rates at the time of their IPOs reveals that the median figure for these companies was 114 percent. For instance, Gitlab’s 179 percent NRR rate means that the company would be able to grow its revenue by 79 percent without acquiring a single new customer, which is nothing short of impressive.
Rule of 40
The rule of 40 is a rule of thumb stipulating that the combined revenue growth rate and profit margin of a SaaS company should be equal to or greater than 40 percent.
Rate of revenue growth + Profit margin ≥ 40
Instead of the established VC view that pushed for growth, growth, and more growth, the rule of 40 brings a more balanced view. It emphasizes that if you managed to grow your revenue by just 15 percent from last year, you would still be on the right track, provided that your EBITDA (earning before interest, taxes, depreciation, and amortization) was at least 25 percent.
The macroeconomic developments of 2022 made this rule of thumb more popular than ever. With the Fed tightening monetary policy through rate hikes, it became obvious that the cost of borrowing would go up. This meant that investors would be less enthusiastic about throwing money at every SaaS project coming their way. The drop in SaaS valuations and investors suddenly getting cold feet in backing projects were the signs that a sea change was underway.
VCs began warning their portfolio companies that there might not be a next round of fundraising and advised them to focus on profitability. Sequoia gathered founders to discuss different scenarios, and YC sent founders a letter titled "Economic Downturn," urging them to prioritize profitability over growth. The message was clear:
“The age of free cash is over. You’re on your own until you show us some results first.”
Here is a short video explaining how the rule of 40 tries to balance growth and profitability:
Why does the rule of 40 matter?
-
Rule of 40 underlines the importance of balancing growth with profitability rather than chasing growth at all costs.
-
There is empirical evidence that healthy SaaS companies that have validated their business models and surpassed $1 million in ARR consistently perform at around this level, which makes this figure a good target to aim for.
It’s worth keeping in mind that the rule of 40 does not apply to early-stage SaaS firms, which find it almost impossible to turn a profit, and thus push for growth at all costs. It applies to SaaS companies that have reached some level of maturity and achieved $1 million or more in ARR, according to Brad Feld, who popularized the rule.
Instead of Neeraj Agrawal’s 3X-3X-2X-2X-2X runaway growth formula, the rule of 40 shifts the focus to profitability at a much earlier stage. The data gathered by Scale from its portfolio companies shows that 40 percent has been a threshold that mature SaaS companies consistently hit over a decade but found it difficult to surpass by a significant margin. Therefore, it serves as a very good proxy for approximating growth and profitability for a specific type of SaaS company.
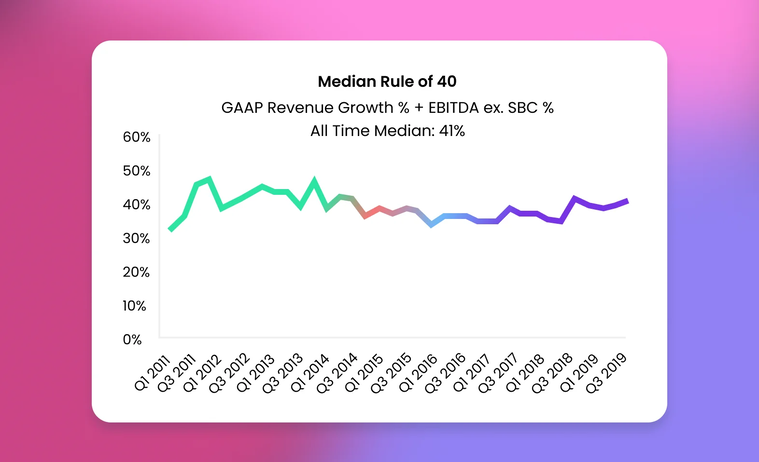
Graph showing the median value for the sum of revenue growth and gross margin for 68 publicly traded SaaS companies. The image was slightly modified for aesthetic purposes. Image credits: Scale.
Gross margin
Gross margin is one of the more traditional metrics that does not require you to jump through hoops to calculate it, but it is still a very valuable source of information.
Gross margin is gross profits presented as a percentage of total revenue. It is the amount of revenue left after the cost of goods is subtracted, expressed as a percentage of total revenue.
Gross margin (%) = [(Revenue - Cost of Goods Sold) / Revenue] X 100
The gross margin figure is different from the net profit margin, which you find by further deducting the operational expenses and taxes.
SaaS businesses typically have a low cost of goods sold as they don’t incur production costs like the more traditional industries do. The COGS in SaaS involves hosting, maintenance, licensing fees, and the money spent on customer onboarding, support, and success. Thus, SaaS companies end up with gross margins of 70-80 percent, with a KeyBanc Capital Markets Technology Group survey putting the median gross margin for SaaS companies at 73 percent. This figure is significantly lower for traditional industries like aerospace and defense (17 percent) and consumer electronics (32 percent).
Why does gross margin matter?
-
Gross margin is a sign of your operational efficiency, showing you how much revenue you need to generate for a certain level of gross profit.
-
The higher the gross margin, the more cash you will have to pay for operational expenses and reinvest in your business.
-
Gross margin also speaks volumes about the value of your business. A company with an ARR of $5 million and 75 percent gross margin can be much more valuable than one with $10 million in ARR and just 25 percent gross margin, as the former will be generating three times as much profit per every dollar of revenue compared to the latter. Shrewd investors would be valuing the first company more highly than the second one.
Burn multiple
The rough couple of years SaaS companies went through at the beginning of 2020s with regard to access to funds inspired come creative metrics that prioritize efficiency. One such metric is the burn multiple, popularized by David Sacks during an economic downturn in the SaaS industry. Burn multiple is a measure of capital efficiency. It measures how much money is spent to achieve the current level of growth.
To calculate the burn multiple, David Sacks took Bessemer’s "efficiency score" and flipped it on its head.
Efficiency Score = Net New ARR / Net Burn
Burn Multiple = Net Burn / Net New ARR
In this inverted version, the formula gives you how much cash you need to burn to generate one unit of growth.
An early-stage SaaS company usually has burn multiples as high as 3 because it is spending a lot of money to test different hypotheses and experiment with different marketing and sales techniques. Also, there is little brand value to speak of, which could have brought in new customers without any added costs. However, if the burn multiple does not improve over time, it means that the company failed to find a more efficient way of generating revenue, which is a serious problem that requires immediate attention.

Burn multiples and what they mean for SaaS companies. The image was slightly modified for aesthetic purposes. Image credits: The Burn Multiple | David Sacks.
Why does burn multiple matter?
Burn multiple is important because any serious problem the company is experiencing on the cost or revenue fronts will be reflected either in the money spent or the ARR generated. David Sacks lists five major problem areas that will have an impact on burn multiple:
Gross margin — A lower growth margin means you don’t generate enough revenue for the COGS you incurred. The burn will increase in such a situation, resulting in a worse burn multiple.
Sales efficiency — Problems with inefficient sales processes will result in an increasing burn multiple.
Churn — Churn will bring the ARR down, meaning the same burn will be raking in less revenue, causing a worse burn multiple.
Traction and growth — The futile marketing and sales efforts that fail to generate desired levels of traction and growth will show in the increased burn rate without a corresponding increase in revenue.
Leadership — A consistently high burn multiple is indicative of the possibility that the decision-makers do not have the skill or the will to improve this metric.
How does Peaka help you with tracking growth metrics?
Gaining full visibility into your growth metrics requires you to
- Unify the data you have scattered across multiple platforms,
- Turn your consolidated datasets into a dashboard that reveals trends.
Peaka’s unique set of capabilities ticks both boxes.
-
Peaka enables you to combine data from different sources, be they CRMs, databases, or SaaS applications, with zero-copy. It eliminates the need to first copy and move the data into a data warehouse. Without any ETL pipelines to build and maintain, IT teams become instantly more productive and channel their resources to core engineering activities.
-
When it comes to visualizing data, Peaka supports ready-made integrations with top-notch BI platforms such as Looker Studio, Power BI, Tableau, Metabase, and Apache Superset™. This allows you to turn your tabular data into dashboards, track saas metrics that matter, and generate reports without relying on the engineering team.
Peaka brings down the technical barriers to data integration and visualization and democratizes those tasks for everyone. It empowers business teams to self-serve without waiting for support from data teams, monitor key SaaS metrics and KPIs at all times, and make informed decisions based on real-time data.
SaaS growth metrics content to consume
- Video–The SaaS Business Model & Metrics: Understand the Key Drivers for Success | David Skok
- Podcast—5 SaaS Metrics that Matter to Investors with Jess Bartos of Salesforce Ventures
- Article–SaaS Metrics 2.0 – A Guide to Measuring and Improving What Matters
Conclusion
Growth metrics are indispensable to decision-makers at SaaS companies. However, they offer the most value when they are put into a context that offers visibility into the efficiency of operations, showing you not only how far you have come but also at what cost.
In essence, these growth metrics serve as a compass, guiding businesses toward their goals while identifying potential pitfalls along the way. By consistently monitoring these metrics, companies can make data-informed decisions, adapt their strategies, and ultimately boost their growth. Therefore, understanding and leveraging these metrics should be a top priority for businesses seeking to thrive in today's competitive landscape.
 Please
fill out this field
Please
fill out this field