
Why You Need to Use SaaS Analytics Tools in 2026
What we witnessed in the software industry in the last two decades was nothing short of a revolution. The Internet infrastructure got better and helped cloud-computing grow by more than 500 percent from 2010 to 2020. As a result, SaaS became the dominant form of software distribution in the 2010s.
SaaS not only revolutionized how software is delivered but also changed how software products are developed, marketed, sold, and continuously improved. It integrated software development, marketing, and sales functions like never before. Relying on recurring revenue rather than one-time transactions, SaaS companies felt pressed to sustain and nurture a relationship with their customers, which required understanding them first.
SaaS analytics emerged from this need to quantify how customers interact with a product, derive insights, and use them to improve the product and sell more of it.
What is SaaS analytics?
SaaS analytics refers to the way SaaS companies track, bring together, and analyze their data to make better decisions. The emergence of SaaS analytics as a discipline resulted from the business model the SaaS concept introduced.
The SaaS model might have changed the way we buy software, but it's the after-sales process where it truly differentiates itself from traditional businesses. SaaS companies rely on recurring revenue to grow, which does not happen without retaining customers first and then adding new ones. This reliance on customer retention changes the whole game, as the SaaS analytics guru David Skok points out in one of his articles:
"SaaS and other recurring revenue businesses are different because the revenue for the service comes over an extended period of time (the customer lifetime). If a customer is happy with the service, they will stick around for a long time, and the profit that can be made from that customer will increase considerably. On the other hand, if a customer is unhappy, they will churn quickly, and the business will likely lose money on the investment that they made to acquire that customer. This creates a fundamentally different dynamic to a traditional software business. There are now two sales that have to be accomplished:
1. Acquiring the customer
2. Keeping the customer (to maximize the lifetime value)."
While customer retention concerns put pressure on SaaS companies and require frictionless customer experience, the SaaS model also presents its practitioners with opportunities to create life-changing products. Thanks to the cloud-based nature of SaaS, every user interaction with a product becomes a data point, giving a SaaS company unprecedented visibility into how its product is being used in real life. Successful SaaS companies are the ones that collect, analyze, and interpret this data and develop products that perfectly fit the needs of their customers.
Tune into this video by David Skok for a primer on the SaaS business model and why analytics is indispensable for success in SaaS:
Key takeaways
-
SaaS analytics encompasses how you track, unify, and analyze your SaaS data to make better decisions.
-
SaaS analytics helps you see which parts of your marketing strategy work, create ideal customer profiles, and evaluate past performance.
-
SaaS analytics comprises three main types: Product, marketing, and revenue analytics.
-
Marketing and revenue attribution tools are becoming more popular as they enable you to identify the ads, content, and campaigns that create value for your company.
SaaS in numbers
-
According to a forecast by Gartner, the end-user spending in the SaaS sector will reach $299.07 billion in 2025, marking a 19.2 percent growth over the 2024 figure of $250.80 billion.
-
A recent study by Precedence Research forecasts the global SaaS market size to reach $1,251.35 billion in 2034, with a compound annual growth rate of 13.32 percent from 2025 to 2034.
-
The same study projects the U.S. SaaS market to grow from $115.82 billion in 2024 to $412.14 billion in 2034.
-
There are more than 16,000 SaaS companies in the U.S. as of 2025.
-
A study conducted by BetterCloud among 568 IT professionals has revealed that the average number of SaaS apps used by companies with 1,500 to 4,999 employees decreased from 142 in 2023 to 101 in 2024.
Why do you need SaaS analytics?
In a business environment where we are overwhelmed by data pouring in from all directions, SaaS analytics is more important than ever. Here are three main reasons you need to invest in analytics if you're running a B2B SaaS company:
To see what works and what doesn't
SaaS analytics help users recognize patterns and trends in their business operations. These patterns reveal how the product resonates with customers, the friction points, the features they love, and those they don't like or understand. SaaS analytics puts an end to what you think your product is and shows you what your customers think it is.
This last point is particularly critical for startups, which have no data at the beginning and have to make decisions based on various assumptions and hypotheses. SaaS analytics exposes which of these assumptions were true and which hypotheses held. If the startup in question manages to track and unify its data, the analytics can help ensure that future decisions will be data-driven instead of throwing things against the wall and seeing what sticks.
To create ideal customer profiles and segment the market
No company can serve everyone at the same time. There has to be a categorization of some kind, and we all know that "not all segments are created equal."
That's why companies study their potential customers and prioritize the needs of a smaller group among them. These are the customers with pains that are a better fit for a product. Companies strive to target these best-fit customers because they are more likely to make repeat purchases, upgrade, and refer new customers.
That's where SaaS analytics comes in handy. Data can speak volumes about your best-fit customers, provided that you can enrich it with firmographic, demographic, technographic, and psychographic data. This data can help align marketing and sales activities and ensure that the messaging and marketing companies are personalized for the higher-value segment, which will shorten the sales cycles as a result.
To evaluate past performance
SaaS analytics brings a structure to how data is to be tracked, unified, and leveraged. When done right, SaaS analytics identify high-level KPIs and low-level, more focused metrics. With metrics and KPIs at hand, it will be easier to establish ownership of goals across the company. SaaS analytics aligns a company around measurable goals and brings accountability to the day-to-day processes and quarterly operations.
Once accountability is established, individual and team performance can be more objectively evaluated and communicated to employees. SaaS analytics visualized in a dashboard reveals where employee performance needs to improve and makes one-on-one coaching of employees possible.
Measuring the success of marketing campaigns is a challenge for companies. SaaS analytics helps users correctly attribute success to marketing initiatives undertaken and measure the return on marketing dollars spent. It enables more efficient use of resources and makes it possible for marketing teams to identify the relative performance of different channels like social media, email marketing, or content marketing. More on marketing and revenue attribution later.
Types of SaaS analytics
SaaS analytics is a vast and expanding field. For the sake of practicality, it is best to examine it under three headings:
1. Product analytics
Product analytics is the process of tracking and analyzing how users engage with your digital product and making day-to-day and strategic decisions based on insights drawn from this process. Product analytics enriches the qualitative data you receive from customer surveys and interviews with quantitative data from product usage. SaaS companies rely on Build-Measure-Learn cycles to develop their products, and product analytics tools are what make this possible. As Fatih Koca, currently the head of Global Service OPerations Data Team at Google puts it succinctly, “What you measure grows.”
A good product analytics tool helps you solve some major problems by letting you
-
Understand how your users engage with your product. Product analytics reveal valuable information about your churn and retention rates and your daily, weekly, and monthly active users.
-
Discover the friction points and wow moments your users experience. Product analytics help you address pain points and double down on things that delight your customers.
-
Streamline your product. Product analytics allows you to see which features create value for your product and which ones don't. Using this information, you can create a leaner user experience.
-
Conduct cohort analysis. Product analytics tools enable you to group customers according to customer attributes like the pricing plan they subscribed to, the country they are based in, and their usage habits. This help
2. Marketing Analytics
Marketing analytics is the collection and evaluation of data to inform marketing efforts. Organizations use platforms like Google Analytics, HubSpot, and Salesforce to consolidate and make sense of their data.
Marketing analytics helps users to
-
Establish a goal-oriented culture. Marketing analytics allows marketing and sales teams to set goals and align their activities around these goals.
-
Identify metrics that help quantify marketing performance. Marketing analytics provides users with data on the email campaigns, ads, and other content like podcasts, blogs, and videos created and how well they resonated with the targeted groups. By turning data into information, marketing analytics enables users to channel resources into more productive marketing activities.
-
Segment your customers according to common attributes. Thanks to marketing analytics, you can group your customers, form tiers depending on the account value they offer, and create personalized messaging that will appeal to them.
3. Revenue analytics
Revenue analytics refers to the collection and analysis of data to evaluate revenue generation activities. SaaS companies are characterized by strong revenue growth—that's what sets them apart from SMBs. Therefore, revenue analytics is essential for SaaS companies willing to achieve exponential growth.
Thanks to revenue analytics, users can
-
Understand customers. Diving deep into revenue data reveals the best-fit customers who have urgent pains that your product solves. Capitalizing on this group can power your revenue growth.
-
Forecast future revenue. Past data sheds light on cyclical trends and let users brace up for a spike in demand or look to secure external funding in the face of a sharp fall in revenue.
-
Uncover new sources of revenue growth. Revenue analytics helps users identify the highest-value accounts and repeat customers, who are prime candidates for upselling and cross-selling initiatives.
Which SaaS metrics should you track?
1. Monthly churn rate
The monthly churn rate represents the percentage of customers who canceled their subscriptions in a given month. It is one of the staple metrics to gauge the health of a business and a sign of how close it is to product-market fit.
MRR = Average Revenue Per User (ARPU) X Total Number of Subscribers
A high monthly churn rate tells that something is seriously wrong with your product, which you have to look for ways to fix to retain customers and grow. Software bugs, friction in the onboarding process, or poor customer support are the usual suspects when facing a high monthly churn rate.
The monthly churn rate is a particularly critical metric for networked products. These products depend on the existence of a network for users to derive value from them. A high monthly churn rate means there are fewer and fewer people using a product, which undermines its value and may render the product useless for the remaining users at some point.
2. Annual recurring revenue (ARR)
ARR refers to the recurring revenue a business earns from its subscribers normalized for a year. It's regarded as a reliable indicator of a company's long-term viability. Investors focus on this metric while assessing the potential of a startup and deciding whether to invest in it. Doubling and tripling ARR every year is how successful startups stand out from mediocre ones and SMBs.
ARR = MRR X 12
However, ARR lacks the precision one expects from a metric that informs strategic decisions. That's why it needs to be broken down into its components:
- new ARR (revenue from brand-new customers)
- expansion ARR (revenue from upselling or cross-selling)
- churned ARR (lost revenue from cancellations)
- contraction ARR (lost revenue from customers downgrading to a lower-priced plan)
- net new ARR (the change in annual revenue compared to the year before)
3. Customer lifetime value (CLV)
CLV is the total revenue a business can expect to earn from a customer over the course of the business relationship. It helps identify the customers that create the highest value for a company and, in a sense, separates the wheat from the chaff.
CLV = (Average Revenue Per User) / (Customer Churn Rate)
CLV matters because capitalizing on existing high-value customers is the shortest route to revenue growth. Customer acquisition cost for these accounts is already incurred, and these customers tend to spend more on upselling and cross-selling offers. Low CLV may indicate inefficient operations that need to be phased out. Eliminating products that are not popular with high CLV customers can help streamline the product range and improve ROI.
4. Net revenue retention (NRR)
NRR is the percentage of the recurring revenue your business can retain over a certain period. A positive NRR reflects that you are growing your revenue base, which is a sign that your business model is working. Successful B2B SaaS businesses are characterized by high NRR.
NRR = [(Starting MRR + Expansion MRR — Contraction MRR — Churned MRR) / Starting MRR] X 100
The reason NRR is regarded as a north star metric is that it measures revenue and sheds light on the efficiency of your whole operation. Cancellations and downgrades are inevitable, but if you can still grow your business despite those setbacks, it means that the positives outweigh the negatives. Whether it's a certain feature of your product, the user experience you offer, or the customer success effort, you are doing something right. Identifying those strengths and doubling down on them should be the next step.
5. Customer Acquisition Cost (CAC)
CAC is the total money spent on marketing and sales to acquire a new customer. This figure includes ads spend, employee salaries, production and publishing costs associated with marketing content, overhead costs regarding software and technical equipment needed to sustain marketing and sales effort, and maintenance.
CAC = (Sum of all sales- and marketing-related expenses) / (Number of new customers added)
CAC is one of the fundamental metrics in unit economics. It is an indicator of the efficiency of your marketing and sales efforts and how well they are aligned. You don't want to pour money into acquiring customers who will generate less CLV than the money it costs to acquire them. Successful SaaS businesses use two benchmark figures to gauge their performance:
-
One should earn from a customer three times as much money as one spends acquiring them.
-
It should take a company 12 months or less (payback period) to recover the money spent on customer acquisition.
6. Average ticket count, backlog, and resolution time
These three metrics give you a well-rounded idea about the frequency of technical problems your customers are having with your product and how your customer support team is handling the requests for support.
The average ticket count measures the number of support tickets your team receives on a given day, week, or month. Sudden and sustained increases in the number of support tickets may point to a serious problem with your technical infrastructure or a major bug in your software.
Your average ticket backlog speaks volumes about your team's performance in responding to and resolving support tickets and the rate at which new tickets are created. A growing backlog of tickets can be a sign of serious issues with your product or an underperforming customer support team.
The average ticket resolution time is the metric that tracks the performance of your customer support team. A long resolution time means you have to invest in training and expanding your customer support team, or the issues with your product are too complex to deal with.
7. Customer conversion rate
Customer conversion rate refers to the percentage of users who have completed a predefined desired action. This action may differ from one part of the marketing or sales funnel to another, like visiting the website, signing up for a demo, opening an email, or entering credit card info.
Customer conversion rate is calculated by taking the number of customers who completed a particular action, like opening an email, and dividing that number by the total number of customers exposed to that particular request or trigger.
Conversion rate = (Total number of conversions) / (Total number of users engaged)
Conversion rates are important to evaluate the marketing and sales decisions and actions taken along a funnel. Ads and content that generate low conversion rates can be revised for messaging and SEO or discarded altogether. Conversion rates also serve as reference points for salespeople further down the funnel. These people can use conversion rates to forecast the number of customers they will be working with when it's their turn.
For a discussion of these SaaS metrics and a few more, give a listen to this podcast by the renowned tech executive, investor, and consultant Dave Kellogg:
4 SaaS analytics tools to keep an eye on
B2B sales is a long-winded process with multiple touch points. As a decision-maker, you want to know which one of your decisions and experiments paid off and which ones did not. That’s why marketing attribution, the way marketers assess the ROI of marketing decisions and actions, is becoming increasingly popular:
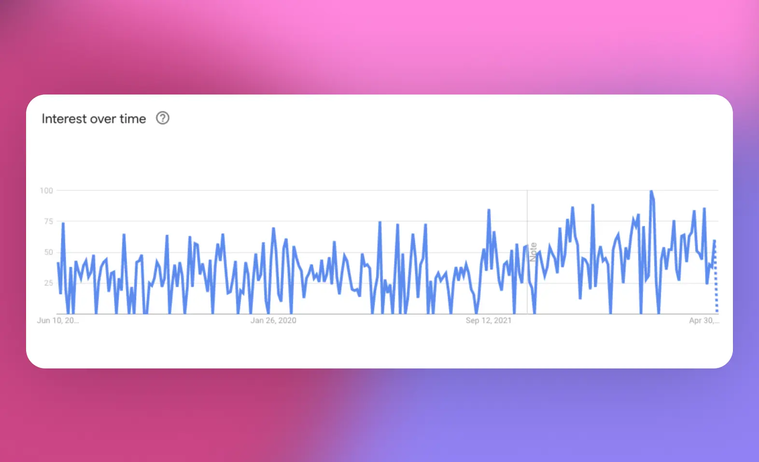
Graph showing the change in the U.S.-based Google searches for the term "marketing attribution" over the last five years. Image credits: Google Trends. The image was slightly modified for aesthetic purposes.
Here is a look at four tools that help SaaS companies with the marketing attribution problem:
Dreamdata
Dreamdata is a revenue attribution tool that lets users view the whole customer journey, understand how customers interact with a product, and glean the impact different ads, campaigns, and channels have on revenue. It gives its users visibility into conversion across all touchpoints, making them see which trigger led to a conversion.
Strengths
-
Dreamdata offers one of the richest integration catalogs in the segment. Its ability to bring in data from a plethora of data sources make it easier to enrich the data and create a complete picture of the customer journey.
-
Dreamdata’s reports beat those of the competitors on granularity.
Weaknesses
-
Dreamdata is a complicated tool with a challenging setup process, especially for the uninitiated.
-
Its data visualization capability, too, leaves much to be desired. Dreamdata offers dashboard templates for common use cases, but it may come up short when the customers develop more sophisticated needs in time. Customizable dashboards would work wonders to address the needs of diverse customer groups.
Integrations
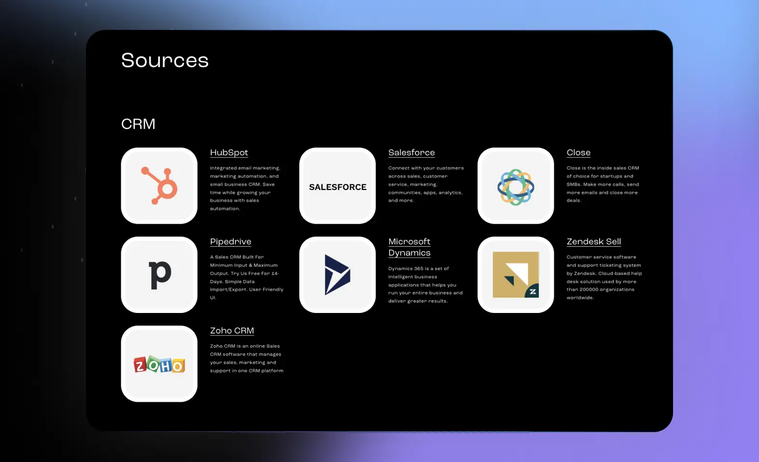
CRM integrations offered by Dreamdata. Image credits: Dreamdata.
In addition to CRM suites like HubSpot, Salesforce, Pipedrive, and Zoho CRM, Dreamdata integrates with Google Ads, Facebook Ads, LinkedIn Ads, and Google Search Console.
HockeyStack
HockeyStack is another option if you are trying to see what part of your marketing and sales funnels are working and driving your revenue and which parts are underperforming. It links marketing data to usage and sales data, revealing how marketing initiatives contribute to a company's bottom line.
Strengths
-
HockeyStack comes with an easy setup process and a no-code user interface, making it particularly suitable for small startups that can't afford large, specialized marketing teams.
-
It offers a survey feature, which lets you dig into the prehistory of your relationship with your customers and learn how they heard about you.
-
Another cool feature is the visualizations representing your funnels and conversions that take place along the customer journey. The customization options in reporting and dashboards enable HockeyStack to handle different visualization needs.
Weaknesses
-
HockeyStack offers a limited number of out-of-the-box integrations, although the team develops integrations with niche tools when customers demand so.
-
Despite offering customized reports and dashboards, HockeyStack fails to provide the desired level of granularity with its reporting.
Integrations
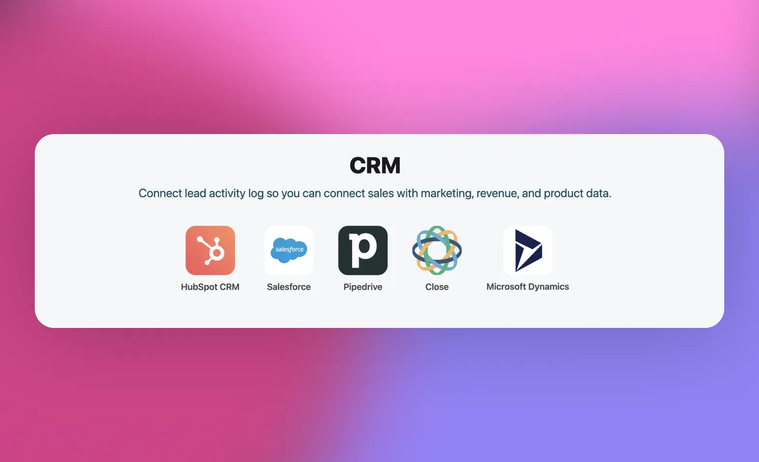
CRM integrations offered by HockeyStack. Image credits: HockeyStack.
HockeyStack integrates with major CRM platforms like HubSpot, Salesforce, Pipedrive, and Close, on the one hand, and Google Ads, Facebook Ads, and LinkedIn Ads, on the other. The tool may be expected to offer more integrations as it matures.
Ruler Analytics
One of the more specialized players in the market, Ruler Analytics is a tool that unifies data from different channels and activities for the purpose of marketing and revenue attribution. It tracks leads across every touchpoint through a customer's journey and gives its users a holistic view of the impact their marketing efforts are generating.
Strengths
-
Ruler Analytics' reports offer high granularity as they break down data into lower-level components. This lets users see which channels, campaigns, and keywords are responsible for the conversions.
-
Its capability to track phone calls, live chats, and forms serves as an additional source of insights for users.
Weaknesses
-
Reporting function covers only the last 90 days.
-
Revenue analytics does not offer custom dashboards to visualize data. Instead, it scrapes the data and pushes it to other tools that can turn it into charts and dashboards.
-
The setup process is intricate and requires some level of coding knowledge and support from the Revenue Analytics team.
Integrations
Some of the CRM integrations offered by Ruler Analytics. Image credits: Ruler Analytics.
Ruler Analytics integrates with major CRM platforms like HubSpot, Salesforce, Pipedrive, and Zoho CRM. For marketing analytics, it can pull in data from Google Ads, Facebook Ads, LinkedIn Ads, and Google Analytics. Its integrations with Intercom and Drift add another dimension to the lead traction efforts.
Factors.ai
Factors.ai is primarily a website analytics platform that can integrate with CRM platforms while letting its users track content performance and analyze site visitor behavior. It complements its website analytics capability with multi-touch revenue attribution, shedding light on the ROI of ads, campaigns, and channels.
Strengths
-
Factors.ai offers its users an anonymous visitor identification capability. Thanks to the reverse IP-lookup technology to track high-intent accounts with the need for visitors to provide contact information.
-
Factors.ai leverages AI to reveal how content, keywords, and specific actions impact conversion metrics throughout the whole funnel.
Weaknesses
-
The limited number of integrations restricts Factors.ai's appeal for different use cases.
-
Factors.ai's graphic representation of data looks like it could use some improvement. The lack of customization in the dashboard undermines the success of the analytics and attribution functions.
Integrations
Integrations offered by Factors.ai. Image credits: Factors.ai.
Factors.ai integrates with major platforms like HubSpot, Salesforce, and Google Ads. It is reasonable to expect the number of integrations to increase in the near future.
B2B SaaS analytics content to consume
- Video–The SaaS Business Model & Metrics: Understand the Key Drivers for Success | David Skok
- Video–Analytics Strategy for SaaS | Fatih Koca
- Podcast–SaaShimi Ep. II: Key SaaS Metrics | Dave Kellogg
- Article–SaaS Metrics 2.0 – A Guide to Measuring and Improving What Matters
- Article–Marketing Attribution: Creating a Growth Engine at Salesforce, Zendesk and Slack
- Opinion–'The Next-era Metrics Playbook' | Kyle Poyar
Conclusion
"Scaling what works and eliminating what doesn't." This is what all SaaS analytics boils down to. If being data-driven is the goal, SaaS analytics is the way to go.
SaaS analytics is the culmination of the efforts to make sense of data. It injects some science into the art of management and tries to make innovation and growth more predictable. Good things happen when you connect your data silos, get them to talk to each other, and actually make sense of the consolidated data. SaaS analytics takes care of the last part. For anything before that, you have Peaka.
 Please
fill out this field
Please
fill out this field