

Before the Warehouse, Lake, and Hub: A Brief History of Data
"Data is the new oil," said the British mathematician Clive Humby in 2006. Even the metaphor itself, whether data was the new oil, the combustion engine, or something totally different, became the subject of articles and spurred long debates. Cumby's words proved prophetic as data was central to the historic rise of Big Tech over the last fifteen years. Data-related jobs are some of the most popular, highest-paying jobs in the tech industry today and even the most modest SMBs are advised to focus on data and make "data-informed" decisions.
Data is defined as the "factual information (such as measurements or statistics) used as a basis for reasoning, discussion, or calculation." This information can be about anything, i.e., the amount of monthly traffic a website attracted, the score each student got in an exam, or the average temperature recorded at a location on a specific day over a decade. Today data may have become predominantly digital, but that wasn't always the case. Let's take a brief look at the history of data and how its nature has changed over the centuries.
Prehistoric Africa
The Ishango bone. Image credits: The Ishango Bone by Matematicamente.it, February 4, 2016, shared under Creative Commons Attribution-Share Alike 3.0 Unported license.
One of the earliest tools used for storing data was discovered in the Democratic Republic of Congo in 1950. Ishango bone is an animal bone with groups of notches carved on it and dates from 18,000 BCE-20,000 BCE. Whether it was a simple tally stick or a more sophisticated tool to track the lunar calendar is up for debate. However, it shows that humans needed data even when they were leading supposedly much more primitive lives than we do now.
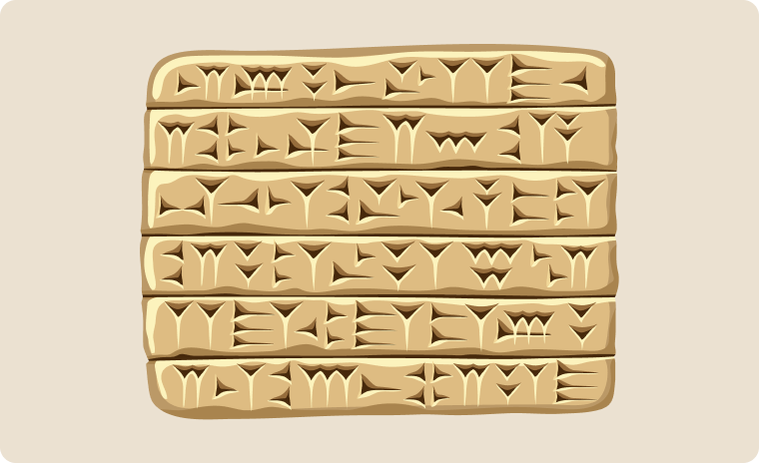
Ancient Babylonia
As society got more complex, so did the types of data people needed to track. Studies led by Professor Eleanor Robson of University College London have shed light on how Babylonians used clay tablets to store data. This Mesopotamian civilization took a census took a census every six or seven years to count the people and livestock and record the amount of milk, honey, wool, and vegetables produced. The aim was to determine the number of people that could be taxed or called up for military service. With its seat of power located between the Euphrates and Tigris rivers, the Babylonian rule depended on controlling water resources, expanding irrigation, and undertaking massive public works projects. This endeavor involved the mobilization of a large workforce, provisioning of supplies for these people, a bureaucracy to oversee the projects, and lots of account keeping.
Babylonians used clay tablets to create tabular accounts for keeping track of data. For example, a Babylonian tabular account dating from 2028 BC demonstrates a tally of sheep and goats. Later examples were more sophisticated. One tablet found in the city of Nippur was used to account for a ditch construction project, with headed columns and each row denoting the length and width of walls being built, the name of the worker responsible, and total wages to be paid in grain and wool.
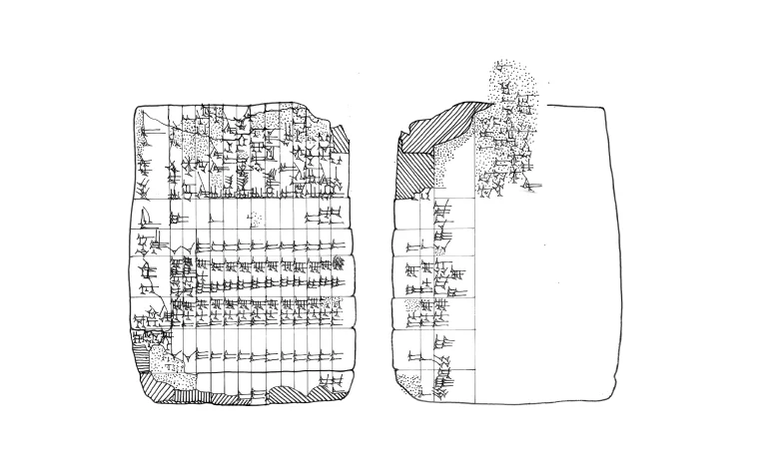
The Babylonian tablet found in Larsa. Image credits: (BM 085232) by Eleanor Robson.
Another tablet found in the ancient city of Larsa and dating from circa 1900-1600 BC probably served as a payroll summary from a construction project, showing us the base rate, the amount of work done, and the wage earned. These artifacts demonstrate that the spreadsheet format was the king centuries before MS Excel was a thing.
Roman Empire
Rome was a civilization that perfected record-keeping out of sheer necessity. Ruling over vast territories, building cities, roads, aqueducts, and all kinds of public works, and controlling a war-making machine that was the Roman army, the Roman Empire needed records more than anything. In order to gauge the pool of manpower at hand and determine taxes, The Roman administration conducted a census every five years, with every man and his family returning to his place of birth. Effective taxation kept the Roman administrative machine working, and it was the data collection that made this possible.
Early modern England
John Graunt was a hat maker from London, a growing city frequently hit by bouts of plague in the mid-seventeenth century. His studies on the number of deaths resulting from plague based on the Bills of Mortality were of pioneering character.
Graunt's use of Life Tables derived from the mortality data was a first in the field. Following "a virtual population of one hundred people through the age-specific mortality rates of the actual population," these tables enabled Graunt to make projections about the future and past populations, providing an early example of data-informed policy suggestions. For these tables, Graunt used christening and burial data, aggregated it, and broke it down according to gender and causes of death to reach conclusions that no one else had done before. His book, Natural and Political Observations upon the Bills of Mortality, first published in 1662, changed the way people saw life and death. Grant's work was so influential that he has been credited with laying the foundations of modern demography and statistics.
Modern era
Under the ancien régime, the European society consisted of three classes: Aristocracy, clergy, and peasantry. Social mobility was restricted, the state apparatus was rather small, and the bureaucracy in the modern sense was nowhere to be found. Things began to change with the rise of overseas trade and the emergence of a new class of merchants and later urban professionals. The dealings of these ambitious upstarts brought about an increase in the data produced. It was a faster, more complex world, calling for heavier data use.
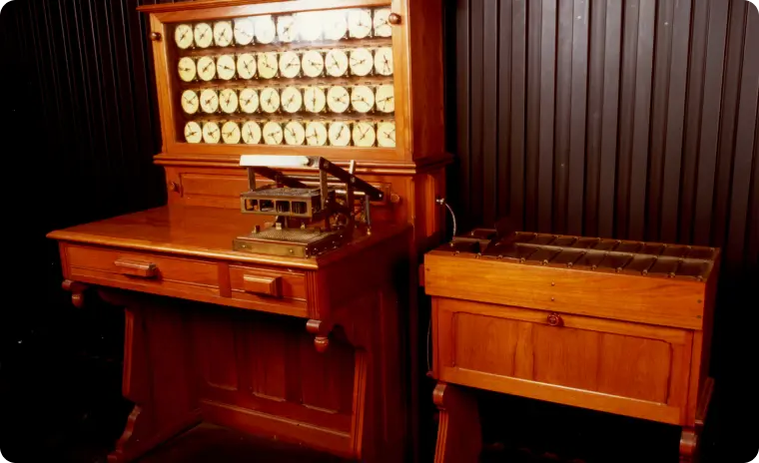
The tabulating machcine developed by Herman Hollerith. Image credits: Tabulatrice, selezionarice e perforatrice holleritho by I.B.M. Italia, May 31, 2016, shared under Creative Commons Attribution-Share Alike 4.0 International license.
The second half of the nineteenth century saw a further uptick in the amount of data produced: The industrial revolution was in full swing, and another revolution in communication was unfolding. The world was a smaller place thanks to new technologies like the telegraph, telephone, and radio. However, the data produced was still at modest levels, manageable by devices like Herman Hollerith's tabulating machine. Hollerith invented a way to store data in machine-readable form in punched cards. His method was used in the U.S. census held in 1890, resulting in time and budget savings. Data processing had become more efficient. The next bottleneck seemed to be data storage. Luckily, Fritz Pfleumer's invention of the magnetic tape in 1928 solved the data storage problem for decades to come.
There was a noticeable pattern in data production and usage up until the mid-twentieth century: The amount of data being produced and people involved in data production was on the rise, but the type of data did not change much. It was mostly structured data produced by governments and different branches of bureaucracy, traders, banks, and industrialists. The general public was not a part of the process yet. What brought the general public into the fold was the introduction of computers in the middle of the last century. The ensuing nonstop miniaturization of computers, capped with the introduction of the Internet in the 1990s, meant that billions of people were producing data in wildly different formats.
From 2007 onwards
If the Internet caused a surge in the amount of data produced, what smartphones, social media, and cloud technology did was trigger a true Cambrian explosion, growing the amount of raw data produced by orders of magnitude. Every like, dislike, click, or move of the mouse was a data point now.
It was around this time, towards the end of the first decade of the new millennium, that we started hearing about data science, data scientists, and data analysts. Overwhelmed by the amount of data unleashed in a short time, people decided to focus on gathering as much data as possible first and worry about making sense of it later. Collecting, sorting, transforming, making sense of, and securing the data became specialized tasks in their own right, requiring expert attention. Concepts like data warehouses, data lakes, and data hubs were all products of the efforts to tackle this sheer volume and complexity of data.
What changed?
The way people treat data has gone through a transformation over the centuries. For ancient people, data was merely a record of past transactions or a predictor of a few phenomena like collectible taxes or available manpower. Today we use data to inform our every decision about the future. Data allows us to monitor the progression of certain processes, and find patterns and trends, making course correction possible. Its importance in our lives justifies further discussion.
 Please
fill out this field
Please
fill out this field


