How to Integrate ServiceTitan with Accounting Software
For private equity firms rolling up home service businesses, operational data is everything. Whether it’s HVAC, plumbing, roofing, or pool cleaning your business specializes in, you can’t drive growth without knowing which branches are performing, where revenue is slipping, and how technician utilization compares across brands.
The challenge? In most roll-ups, each brand runs its own ServiceTitan instance. Pulling performance numbers means chasing multiple teams, exporting CSV files, and manually stitching together reports before every board meeting.
It’s a process that consumes hours, delays insights, and often leaves leadership making decisions based on outdated numbers. And with only a 3–5 year value creation window, that’s a problem you can’t afford.
The pain of manual ServiceTitan reporting
Disconnected ServiceTitan instances create a snowballing effect that leads to inefficiency across the board:
-
Fragmented processes: Each brand rolled up comes with its own reporting habits and KPI definitions, making it difficult for PE leaders to evaluate the performance of comparable business units.
-
Time drain: Reconciling different records and manually integrating data is a time-consuming process. It requires portfolio operators to spend hours (sometimes days) downloading CSVs and replicating data to spreadsheets.
-
Risk of human error: Every manual merge consists of hundreds and sometimes thousands of copy & paste actions, which creates a fertile ground for data inconsistencies and mistakes.
-
Lagging insights: Gathering data from all portfolio companies, reconciling differences, and creating meaningful reports can take weeks, forcing decision-makers to work with outdated data most of the time.
You're reacting to the market instead of leading it, and by then, it's too late.
Why consistency and speed are crucial for PE timelines
Private equity firms operate on compressed timelines. Every quarter matters, and reporting delays can directly impact value creation plans. Faster, more consistent reporting enables:
-
Standardized KPIs across brands for apples-to-apples comparisons.
-
Real-time insights to act on operational trends immediately.
-
Better board communication with consistent, credible data.
-
Operational alignment that helps spread best practices quickly across the portfolio.
In a value creation cycle, time saved on reporting is time invested in driving growth.
The traditional fix and why it falls short
Some PE firms try to solve the problem with a traditional BI stack, pulling ServiceTitan data into Snowflake or BigQuery, transforming it with dbt, and visualizing it in Tableau or Power BI.
But for most home service portfolios, this approach fails to deliver on PE timelines:
-
Months to deploy: Every data stack becomes a project in its own right, with custom integrations and data modeling, which delays time-to-insight.
-
High engineering overhead: Building and maintaining a data stack requires a data team that most operators don’t have.
-
Six-figure costs: Tooling and talent costs add up quickly.
-
Poor fit for lean operators: A traditional stack is overkill for the actual reporting needs of a PE firm. By the time the stack is live, you could already be halfway through your holding period. This is not how smart companies use their resources.
The ideal reporting solution for PE-led portfolios
For private equity operators, the right solution isn’t about more tools or complex data stacks. It’s about speed, consistency, and simplicity. An ideal reporting approach should deliver:
-
Direct connections to multiple ServiceTitan accounts without custom coding.
-
Standardized KPI definitions so that revenue, close rates, and technician efficiency are measured the same way across all brands.
-
Real-time visibility into portfolio performance, eliminating reporting delays.
-
Accessibility for non-technical users, so operators and finance teams can generate insights without relying on engineers.
-
Deployment within days, not months, so value creation plans stay on track.
In other words, the best solution for PE firms is one that replaces spreadsheets with a unified, always-on reporting layer—without the heavy lift of building a full BI infrastructure.
How Peaka simplifies ServiceTitan reporting
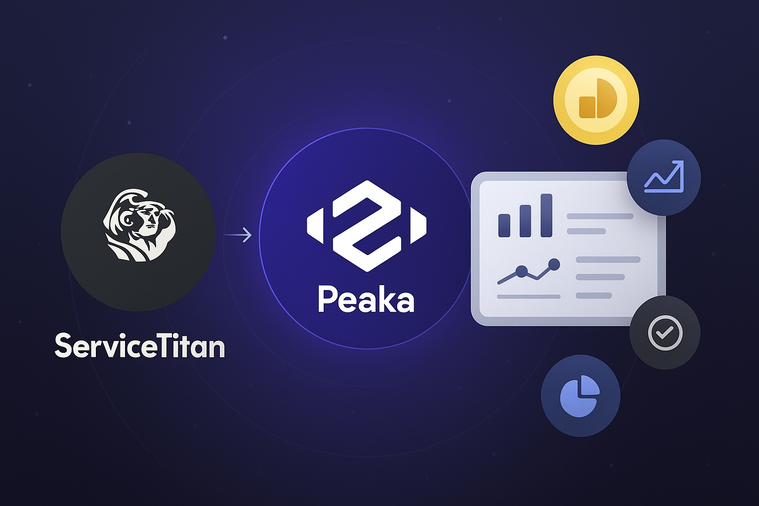
Peaka streamlines the whole reporting process, replacing slow, manual processes with real-time, automated reporting. It achieves this by
-
Connecting directly to multiple ServiceTitan instances without any code or ETL pipelines.
-
Standardizing KPI definitions so you can compare performance across brands.
-
Integrating with accounting tools like QuickBooks, XeroAccounting, or Sage Intacct for reports on revenue, profitability, and job costing.
-
Lowering the technical barriers for non-technical people so they can push their data to Power BI, Looker Studio, and Metabase without a data team.
-
Deploying in days, not months, which makes it a good fit for post-acquisition integration.
Peaka provides you with the insights you need, when you need them, reducing your reporting cycles and helping you take proactive action.
Key takeaways
-
Manual ServiceTitan reporting wastes valuable time and creates inconsistency.
-
KPI dashboards that get updated automatically deliver faster insights and standardized benchmarks.
-
Peaka enables portfolio-wide reporting without huge investments in data warehouses and data teams, which ties in nicely with the timeline of a PE firm.
Conclusion: From manual reports to real-time insights
For ServiceTitan consultants, integrating operational and financial data has always been necessary, but until now, it’s also been painful.
If you’re tired of waiting for reports that never get delivered on time, you may want to start thinking about replacing manual processes. Peaka fits the bill here as it helps you unify and automate your ServiceTitan reporting across the portfolio. No engineers, no spreadsheets—just real-time insights you can trust.
Ready to streamline reporting and scale your services?
Sign up to Peaka for free today.
Book a quick demo and see how we help PE firms replace manual data exports with automated dashboards in days, not months.


 Please
fill out this field


