
How to Fix the Reporting Gap Between Ops and Finance
You have technicians in the field, trucks on the road, and dispatch working smoothly, but reporting still feels like a secondary task, often overlooked and handled with whatever tools are available. Even with systems like ServiceTitan and Sage Intacct in place, many large home service companies with multiple branches and 50-500 employees still rely on manual workflows to get answers to basic operational questions.
If your team is spending hours every week preparing reports, building dashboards, and digging through spreadsheets just to understand what happened last week, you’re not alone. But you’re also not set up for scalable growth.
Let’s break down what’s really going on here and how modern operators are escaping the reporting treadmill.
The weekly reporting grind
Here’s what the typical reporting process still looks like for contractors operating across multiple locations:
-
Export job data from ServiceTitan
-
Pull accounting numbers from Sage Intacct
-
Copy and paste into spreadsheets
-
Clean the data manually
-
Match columns, filter dates, and chase down missing entries
-
(Maybe) push it into a Power BI or Looker Studio dashboard, if someone on the team knows how to set up and use a tool like Zapier
For most ops teams, this eats up hours every week. One mid-sized HVAC company we spoke to reported spending nearly 10 hours/week on reporting across their operations and finance teams.
And what happens when leadership asks for a breakdown by technician, service line, or region? That means another round of manual data exports, filters, and rework for an already busy team.
What this is really costing you
The extra work needed to prepare reports is more than an inconvenience. Manual reporting workflows are actively holding your company back in several ways.
-
Time drain: High-value team members are stuck doing low-value data cleanup that can be automated with the right setup.
-
Slower decisions: You get your reports after the fact, while your teammates are already fighting problems.
-
Higher risk of error: The more manual steps, the more likely someone is to make a mistake.
-
Missed opportunities: Without visibility into your operations, you will inevitably miss out on business opportunities to maximize revenue.
This bottleneck only gets worse if you are a growth-oriented contracting business looking to add new locations, expand services, or roll up smaller shops.
Why the Zapier + BI Tool formula doesn’t work
You might be thinking: “But we already use Power BI” or “We built something in Looker Studio.”
That’s great (until it breaks). Most of the time, your dashboards are only as good as your data pipeline.
Here’s the catch:
-
Outsourced BI gives you dashboards, but you’re stuck waiting days (or weeks) for a consultant to gather your data and build the dashboards you need.
-
Power BI, Looker Studio, and Tableau are capable BI tools, but ServiceTitan lacks connectors for them, and setting them up requires a data engineer on staff (which most companies in this range don’t have).
-
An automation tool like Zapier or Tray.ai might help you move data for very specific, strictly defined use cases, but it’s fragile and prone to breaking when formats change.
In other words, standard solutions will let you down at some point. You need a solution specifically designed for teams like yours: Growth-focused, fast-moving, and resource-constrained.
The better way: Self-serve reporting for everyone
That’s where a solution like Peaka comes in.
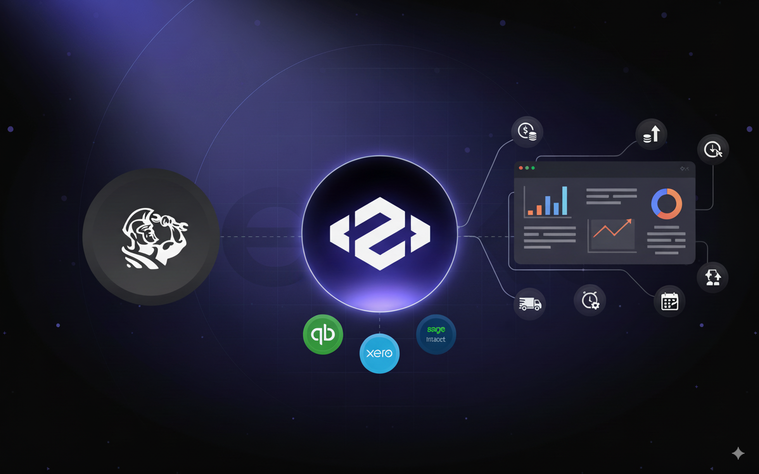
Peaka connects directly to your ServiceTitan and Sage Intacct accounts, bringing together operational and financial data in a unified data layer. In addition to removing the need to download CSVs, copy data from one spreadsheet to another, or maintain a data team, Peaka offers a text-to-SQL capability. This enables non-technical users to dig into their data using natural language prompts in case they are not confident in their SQL skills.
With Peaka, your operations staff, finance team, or even your ServiceTitan lead can consolidate their data, generate reports, and refresh KPI dashboards in real time. This helps them track the metrics that matter most, such as revenue per technician, job costing and gross margin by service line, call booking rates, or marketing ROI by channel.
From hours to minutes: What this looks like in practice
Let’s say you’re running a $20M plumbing and HVAC company with five locations. Your ops team currently spends 8–10 hours each week prepping the Monday morning report deck.
Peaka allows you to
-
Connect your ServiceTitan and Sage Intacct data once,
-
Consolidate data from different accounts and filter it using natural language prompts or AI,
-
Send the consolidated data to your favorite BI tool, turning your data into visualizations that show trends.
That’s not just saving time; it's more about changing how your business operates.
Key takeaways
-
Most growing home service companies still rely on manual reporting, even after adopting ServiceTitan.
-
Time spent on reporting eats into your ops team’s ability to focus on growth and performance.
-
Traditional BI stacks built around spreadsheets, Zapier, and a BI tool are too limited to cover all the data needs of a contractor and still demand a lot of manual work to operate and maintain.
-
Peaka provides a no-code, real-time reporting layer designed specifically for ServiceTitan users running operations across multiple locations.
Conclusion: What could your team achieve with that time back?
Every hour your operations or finance team spends assembling reports is an hour not spent improving margins, training techs, or planning growth. Multiply that by 10 hours a week, 52 weeks a year, and the opportunity cost becomes huge.
The truth is, manual reporting is a legacy habit, not a necessity. As your business grows beyond a single shop, the same spreadsheet-based systems that once worked start to collapse under the weight of multi-location complexity.
The companies winning today aren’t necessarily bigger; they’re faster. They identify issues in real-time, make adjustments mid-week, and possess the data discipline of much larger organizations without hiring a single data engineer.
If your team still treats reporting like a chore, it’s time to change the workflow, not the people.
Ready to reclaim your week?
If your team is still spending hours every week assembling reports, there’s a faster, smarter way.
With Peaka, you can stop building reports and start using them to lead, grow, and stay ahead.
Sign up to Peaka for free today.
Book a demo to see how Peaka helps large contractors manage ops and finance data at scale.
 Please
fill out this field
Please
fill out this field