

How to Build a Churn Analysis Dashboard in 1 Hour Using Peaka and v0.dev
Project Overview
What if your high-paying customers try to tell you something before they churn, and you don’t catch it?
In this tutorial, you will build a dashboard that identifies Pro- and Enterprise-tier subscribers who contacted support shortly before canceling their subscriptions. The goal is to help support and product teams understand churn patterns and take action before it’s too late.
This dashboard provides real value for:
- Customer support teams looking to spot at-risk users,
- Product managers needing context around cancellations,
- Growth and revenue teams focused on reducing churn.
Best of all, instead of spending days coding, you will build this entire system in just 1 hour using Peaka for data integration and v0.dev to generate the frontend.
The Tools You’ll Need / The Stack
Here’s what you’ll use to bring everything together:
- Peaka – A no-code data integration platform that connects and joins data from Stripe and Zendesk, then turns those queries into APIs you can consume.
- v0.dev – An AI-powered tool that generates a full-stack dashboard UI based on a simple natural language prompt.
- Stripe + Zendesk – The core data sources providing subscription details and customer support tickets, respectively.
Why Peaka?
Peaka is a no-code data operations platform that enables you to:
- Connect to external data sources like APIs, databases, and SaaS applications,
- Model your data as virtual tables without moving or duplicating it,
- Create APIs on top of those virtual tables to serve your applications.
For this dashboard, Peaka provides:
- A seamless way to connect Zendesk and Stripe data by matching customer emails,
- A flexible query builder that lets you join support tickets with subscription data using SQL,
- Ready to use API endpoints that you can call directly from your app.
By using Peaka, you avoid building and maintaining a custom backend, saving significant development time and complexity.
Why v0.dev?
With v0.dev, you can:
- Skip writing any frontend code. Just describe your app in a prompt,
- Get a fully functional, developer-friendly UI generated for you,
- Automatically generate backend integration logic that connects to Peaka’s APIs,
- Easily adapt your app by updating prompts or API specs and regenerating the code.
Let's Start
Step 1: Setting Up Your Peaka Project
Before you start building, you need to set up your Peaka workspace and generate an API key for authentication.
Follow these steps:
- Go to peaka.studio and log in.
If you don’t have an account yet, sign up. It only takes a minute.
- Create a new project from your dashboard.
- Open your new project, then click the gear icon (⚙️) in the bottom left sidebar to open Settings.
- In Settings, navigate to the API Keys tab and create a new API key.
- Copy your Project ID from the URL in your browser’s address bar. It should look like this:
`https://peaka.studio/studio/${project_id}/..`
Save both the API key and Project ID safely, you’ll need these when connecting Peaka to v0.dev.
Step 2: Connecting Data Sources in Peaka
With your project set up, it’s time to bring in your external data.
In this example, you’ll connect Stripe and Zendesk to Peaka. These will serve as the foundation for your churn and support analysis.
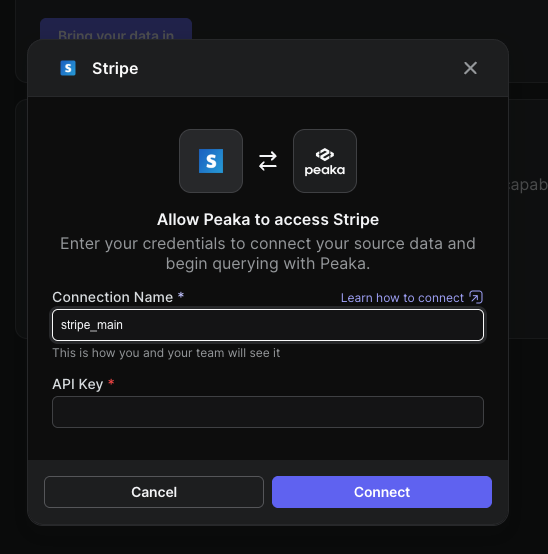
✅ Connecting Stripe
- In your Peaka project, click the ➕ Add button on the left sidebar to open the Connector List.
- Use the search bar to find Stripe among the available connectors.
- Select it, give the connection a name (e.g.,
stripe_main), and enter your Stripe API Key. - Click Connect, and you’re done!
Your Stripe data will now appear under your connected data sources.
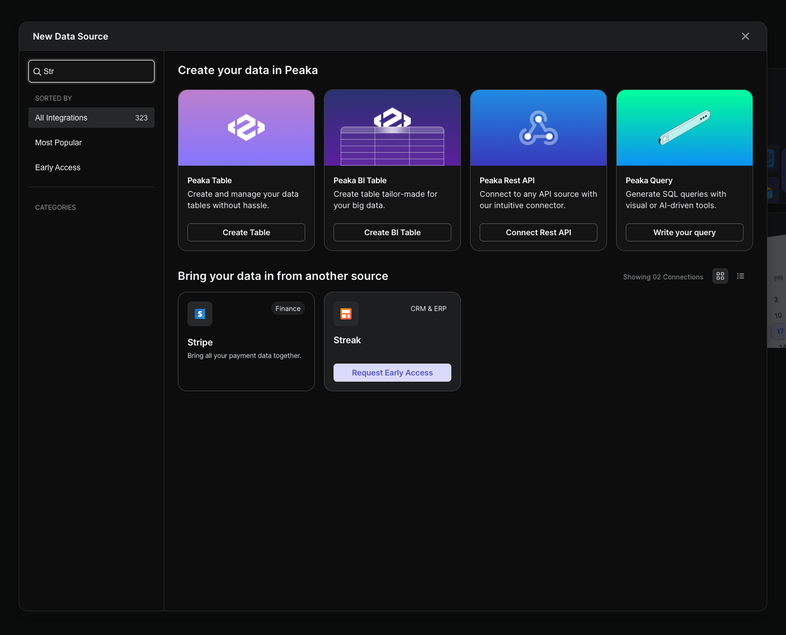
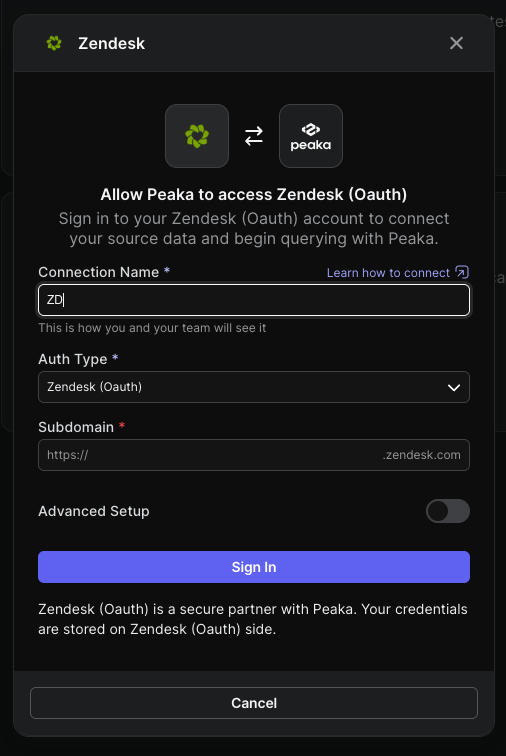
✅ Connecting Zendesk
- Back in the Connector List, search for Zendesk and select it.
- Since Zendesk supports OAuth authentication, setup is quick and easy.
- Provide a connection name and your Zendesk subdomain (e.g.,
yourcompany.zendesk.com). - Peaka will redirect you to Zendesk for login and authorization. Once approved, the connector will be activated.
- You’ll now have access to Zendesk tickets and user data within Peaka, no API handling required.
By the end of this step, both Stripe and Zendesk will be live in your Peaka project fully authenticated and ready to query.
Step 3: Writing Queries in Peaka
With Stripe and Zendesk connected, it’s time to extract insights by writing queries across both data sources.
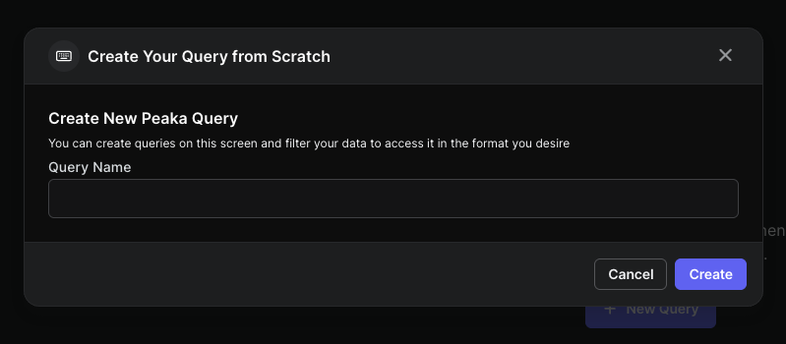
🧠 Creating a New Query in Peaka
- From the left sidebar, go to the Queries section.
- Click ➕ New Query to create a new SQL query.
- Choose Start from Scratch instead of using a template.
(You can explore Peaka’s templates later for common use cases.)
- Write the following SQL queries and click Run to preview the results.
📊 Query 1: Support Tickets Submitted Shortly Before Churn
This query finds Pro or Enterprise users who submitted a support ticket within 14 days before canceling their subscription.
Use it to identify customers who might have been unhappy or struggling and possibly prevent future churn.
SELECT
  u.name,
  prod.name AS plan_name,
  z.subject,
  z.description,
  u.email AS customer_email
FROM
  "zd"."public"."tickets" z
JOIN
  "zd"."public"."users" u ON z.requester_id = u.id
JOIN
  "stripe"."payment"."customers" c ON u.email = c.email
JOIN
  "stripe"."payment"."subscriptions" sub ON c.id = sub.customer_id
JOIN
  "stripe"."payment"."plans" p ON sub.plan_id = p.id
JOIN
  "stripe"."payment"."products" prod ON p.product_id = prod.id
WHERE
  prod.name IN ('Pro Plan', 'Enterprise Plan')
  AND sub.canceled_at IS NOT NULL
  AND z.created_at BETWEEN (sub.canceled_at - INTERVAL '14' DAY) AND sub.canceled_at
ORDER BY z.created_at DESC
LIMIT 100;
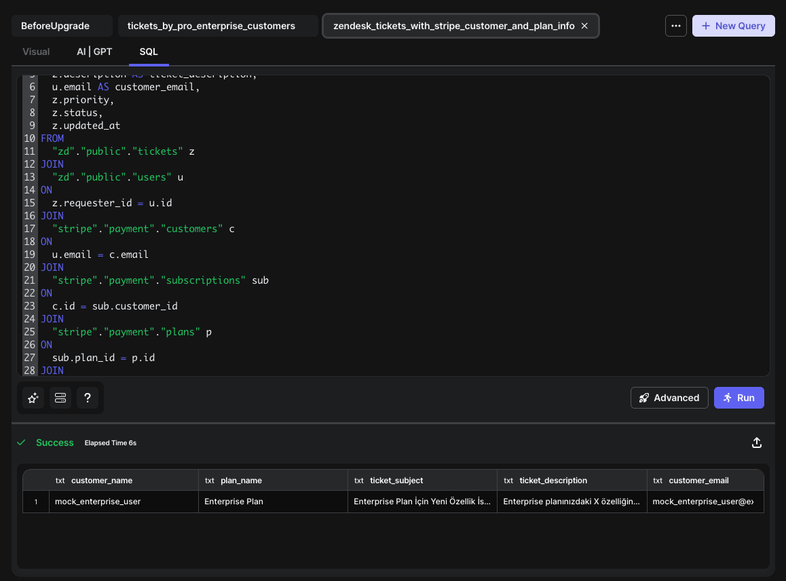
📊 Query 2: All Tickets from Premium Users
This query retrieves all support tickets submitted by Pro and Enterprise plan users, whether they churned or not.
It’s useful for exploring the overall support volume, issue trends, and satisfaction signals from your premium customer base.
SELECT
  u.name AS customer_name,
  prod.name AS plan_name,
  z.subject AS ticket_subject,
  z.description AS ticket_description,
  u.email AS customer_email,
  z.priority,
  z.status,
  z.updated_at
FROM
  "zd"."public"."tickets" z
JOIN
  "zd"."public"."users" u ON z.requester_id = u.id
JOIN
  "stripe"."payment"."customers" c ON u.email = c.email
JOIN
  "stripe"."payment"."subscriptions" sub ON c.id = sub.customer_id
JOIN
  "stripe"."payment"."plans" p ON sub.plan_id = p.id
JOIN
  "stripe"."payment"."products" prod ON p.product_id = prod.id
WHERE
  prod.name IN ('Pro Plan', 'Enterprise Plan')
ORDER BY z.created_at DESC
LIMIT 100;
Step 4: Integrating Peaka Queries into the Frontend with v0.dev
With your Peaka queries ready, you can now build a complete frontend dashboard using v0.dev. This step shows how to integrate live query results into your UI, entirely through prompt-based generation.
💬 Start with a Prompt
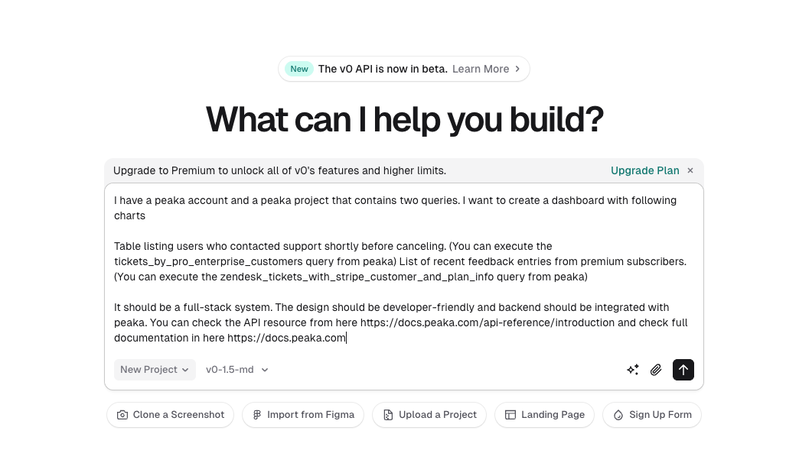
Begin by opening v0.dev and entering a prompt like this:
I have a Peaka account and a Peaka project that contains two queries.

I want to create a dashboard with the following charts:

- A table listing users who contacted support shortly before canceling. (You can execute the tickets_by_pro_enterprise_customers query from Peaka)
- A list of recent feedback entries from premium subscribers. (You can execute the zendesk_tickets_with_stripe_customer_and_plan_info query from Peaka)

It should be a full-stack system. The design should be developer-friendly and backend should be integrated with Peaka.

You can check the API reference here: https://docs.peaka.com/api-reference/introduction
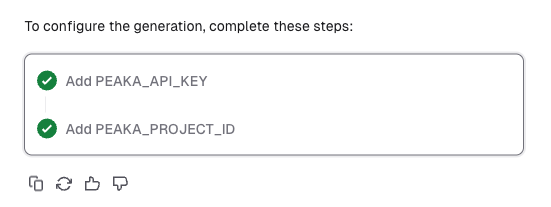
🔐 Set Environment Variables
v0.dev will likely ask you to define the following environment variables to authenticate with Peaka:
PEAKA_API_KEYPEAKA_PROJECT_ID
Use the values you obtained earlier from your Peaka project’s settings and paste them into v0.dev’s environment configuration.
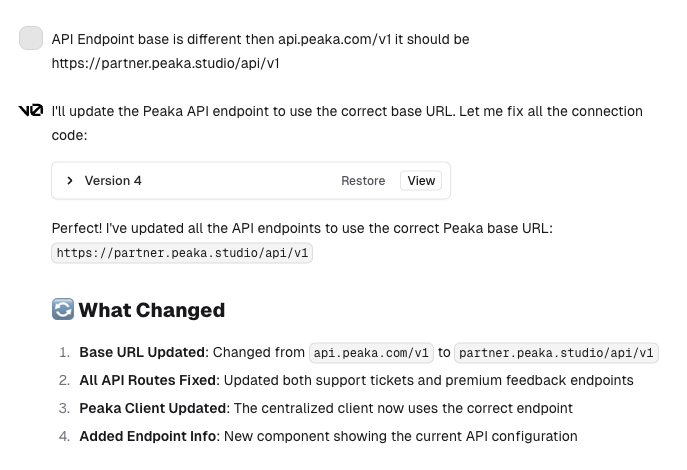
⚠️ Fix the API Base URL
By default, v0.dev may try to connect to https://api.peaka.com/v1, which is not the correct base URL for query execution.
You can fix this by prompting v0.dev with:
API Endpoint base is different than api.peaka.com/v1.
It should be https://partner.peaka.studio/api/v1
If you're using the EU zone, use:
https://partner.eu.peaka.studio/api/v1
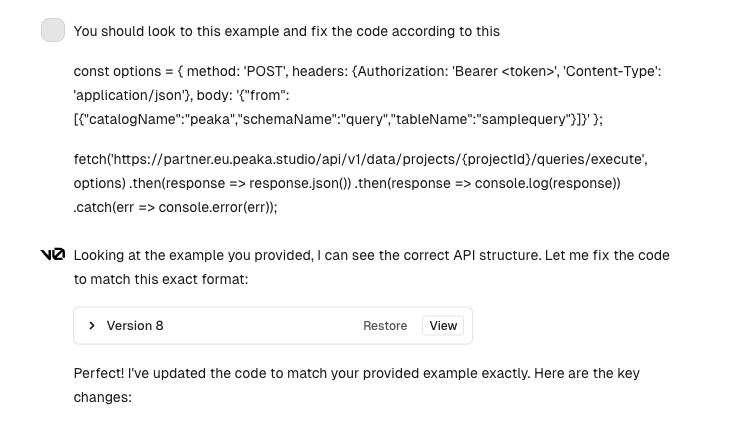
📄 Use the Correct Request Format
After correcting the base URL, you’ll also need to make sure the request payload matches Peaka’s execute-query API format.
You can provide v0.dev with this sample request and response structure, based on the official documentation:
Sample request:
const options = {
  method: 'POST',
  headers: {Authorization: 'Bearer <token>', 'Content-Type': 'application/json'},
  body: '{"from":[{"catalogName":"peaka","schemaName":"query","tableName":"samplequery"}]}'
};

fetch('https://partner.eu.peaka.studio/api/v1/data/projects/{projectId}/queries/execute', options)
  .then(response => response.json())
  .then(response => console.log(response))
  .catch(err => console.error(err));
Sample response:
{
  "columns": [
    {
      "catalogId": "2",
      "catalogName": "peaka",
      "schemaName": "query",
      "tableName": "samplequery",
      "columnName": "amount"
    }
  ],
  "data": [
    [
      {
        "name": "amount",
        "displayName": "amount",
        "dataType": "bigint",
        "value": "75",
        "order": 0
      }
    ],
    [
      {
        "name": "amount",
        "displayName": "amount",
        "dataType": "bigint",
        "value": "75",
        "order": 0
      }
    ],
    [
      {
        "name": "amount",
        "displayName": "amount",
        "dataType": "bigint",
        "value": "75",
        "order": 0
      }
    ]
  ]
}
🪄 Final Touches via Prompt Iteration
Once your frontend is connected to Peaka and fetching live data, you can polish the UI using plain prompts.
For example:
Map the "date" field to the "updated_at" column in the recent feedback table, and remove the "rate" field.
v0.dev will apply your changes automatically, no need to manually edit code.
✅ At the end of this step, you’ll have a dynamic frontend powered by Peaka’s live query data fully operational in under an hour.
Step 5: The Final Dashboard
After hooking up Peaka as the data layer in a v0.dev dashboard, you’ll have a clean, fully functional, and developer-friendly interface, powered entirely by live data from Stripe and Zendesk.
The dashboard consists of two key components:
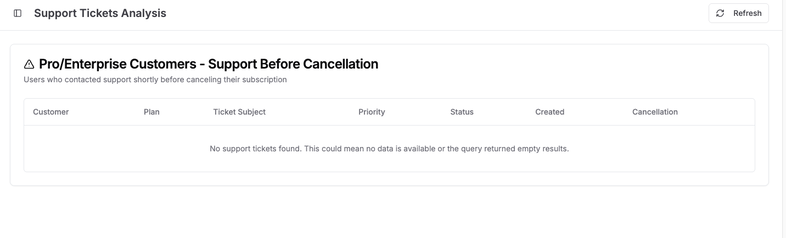
🧯 1. Users Who Contacted Support Shortly Before Churning
This table lists:
- Customer name
- Email address
- Plan type (Pro or Enterprise)
- Ticket subject & description
- Ticket creation date (within 14 days before cancellation)
This component highlights last-minute support activity from users who churned, providing early-warning signals of dissatisfaction or friction. It’s an invaluable tool for customer support and product teams to spot trends behind cancellations.
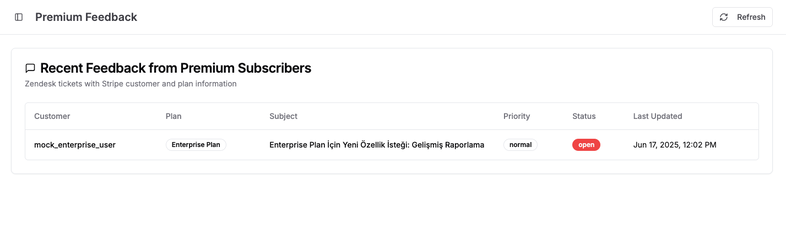
💬 2. Recent Feedback from Premium Subscribers
This section displays all tickets submitted by current Pro and Enterprise users, regardless of churn status. It includes:
- Customer name
- Plan name
- Ticket subject & description
- Ticket priority, status, and last updated date
This real-time view helps teams monitor ongoing support needs and stay ahead of potential churn risks before they escalate.
🚀 Why This Dashboard Delivers Value
This dashboard isn’t just a data visualization, it enables action. Here's how different teams benefit:
- Product teams can identify recurring friction points.
- Support teams can evaluate whether unresolved tickets correlate with churn.
- Revenue & growth teams can track churn trends across plan tiers.
- CSMs can proactively reach out to users showing warning signs.
⏳ Time and Effort Saved
Traditionally, building this system would require:
- Manual API integrations
- Authentication handling
- SQL joins and data modeling
- Backend service development
- Frontend component coding
…resulting in days or even a week of effort.
By using Peaka + v0.dev, the same outcome can be achieved in under an hour, with:
- No custom backend development
- No manual UI coding
- Just clear prompts and a few API keys
💡 This is a fast, scalable way to ship internal tools or MVPs using live SaaS data without compromising on developer experience.
Real-World Use Cases
This exact approach can be adapted for various needs:
- Support teams: Proactively identify at-risk customers.
- Product teams: Spot recurring feedback from premium users.
- Growth teams: Understand why high-value customers churn.
All without hiring a data team or building internal tools from scratch.
The Conventional Way
The traditional approach would have looked like this:
- ETL pipeline to pull data from Stripe and Zendesk,
- A data warehouse to store and query the results,
- A backend service to expose APIs,
- A frontend team to build a dashboard.
Estimated time: 2–3 days, at minimum.
Peaka + v0? 1 hour.
Key Takeaways
- Churn signals often hide in support data: Users who reach out to support shortly before canceling are waving red flags. Surfacing these interactions helps teams take proactive action before it's too late.
- Peaka makes integrations painless: Connect to platforms like Stripe and Zendesk without writing any code, model the data with SQL, and instantly turn queries into APIs.
- v0.dev eliminates frontend overhead: With natural language prompts, you can generate fully functional dashboards that connect to live data, no UI or backend coding required.
- 1 hour = days of saved effort: What would normally take days, building data pipelines, backend services, and frontend components, can now be achieved in under an hour.
- Accessible for non-technical teams: PMs, support leads, and growth managers can gain insights without needing to write a single line of code.
- Flexible and reusable: The same structure can be repurposed for different queries, data sources, or dashboard layouts with minimal changes.
🎯 Bottom line: Skip the complexity, accelerate insight.
Peaka + v0.dev is a turbocharged way to build MVPs and internal tools.
Conclusion
By simply:
- Connecting Zendesk and Stripe to Peaka,
- Writing two SQL queries,
- Prompting v0.dev to generate the frontend,
I built a fully functional, data-powered churn insight dashboard in just 1 hour.
If you’re a developer, or even a PM who wants results without the overhead of building everything from scratch, give this combo a try.
 Please
fill out this field
Please
fill out this field